Project Description

This project provides tools for analyzing DNA nucleotide barcode sequences derived from the BIOSCAN-1M and BIOSCAN-5M datasets. The data is hierarchically structured by taxonomic ranks—from phylum down to species—where each rank contains subgroups of identical barcode sequences. The project enables statistical analysis of DNA barcode variation across taxonomy to support biodiversity and bioinformatics research.
Key Contributions
- Processed and analyzed DNA barcode data from BIOSCAN-1M and BIOSCAN-5M across hierarchical taxonomic ranks.
- Computed Shannon Diversity Index (SDI) to quantify genetic richness and evenness within taxonomic subgroups.
- Measured genetic similarity using pairwise Damerau–Levenshtein distances on aligned DNA barcode sequences.
- Implemented subgroup filtering, random sampling, and alignment strategies to support large-scale analysis.
- Developed dual pipelines using Pandas for small datasets and Apache Spark (PySpark) for multi-million–record datasets.
- Aggregated statistical summaries (mean, median, standard deviation) of diversity and distance metrics across taxonomic levels.
- Applied interquartile range (IQR)–based analysis to characterize distribution spread and identify variability and outliers.
- Generated distribution plots and boxplots to visualize SDI and pairwise distance statistics across taxonomic ranks.
- Enabled reusable outputs (Parquet files and DataFrames) for downstream bioinformatics and ML workflows.
Tools & Technologies
- Python, PyTorch, TensorFlow, Pandas, NumPy, PySpark (pyspark.sql)
- h5py, CSV, JSON, Pickle, Parquet, DataFrames
- Matplotlib (mpl_toolkits), Seaborn, Plotly
- Cluster Computing, Parallel Computation
- Virtual Environment, Bash Environment
- Digital Research Alliance of Canada
Code / Git
Research / Paper
Additional Context
DNA Barcode Sequence
A DNA barcode sequence represents the ordered arrangement of the four nucleotides— Adenine (A), Thymine (T), Cytosine (C), and Guanine (G)—within a specific gene region, commonly the mitochondrial cytochrome c oxidase subunit I (COI) gene.
TTTATATTTTATTTTTGGAGCATGATCAGGAATAGTTGGAACTTCAATAAGTTTATTAATTCGAACAGAATTAAG...
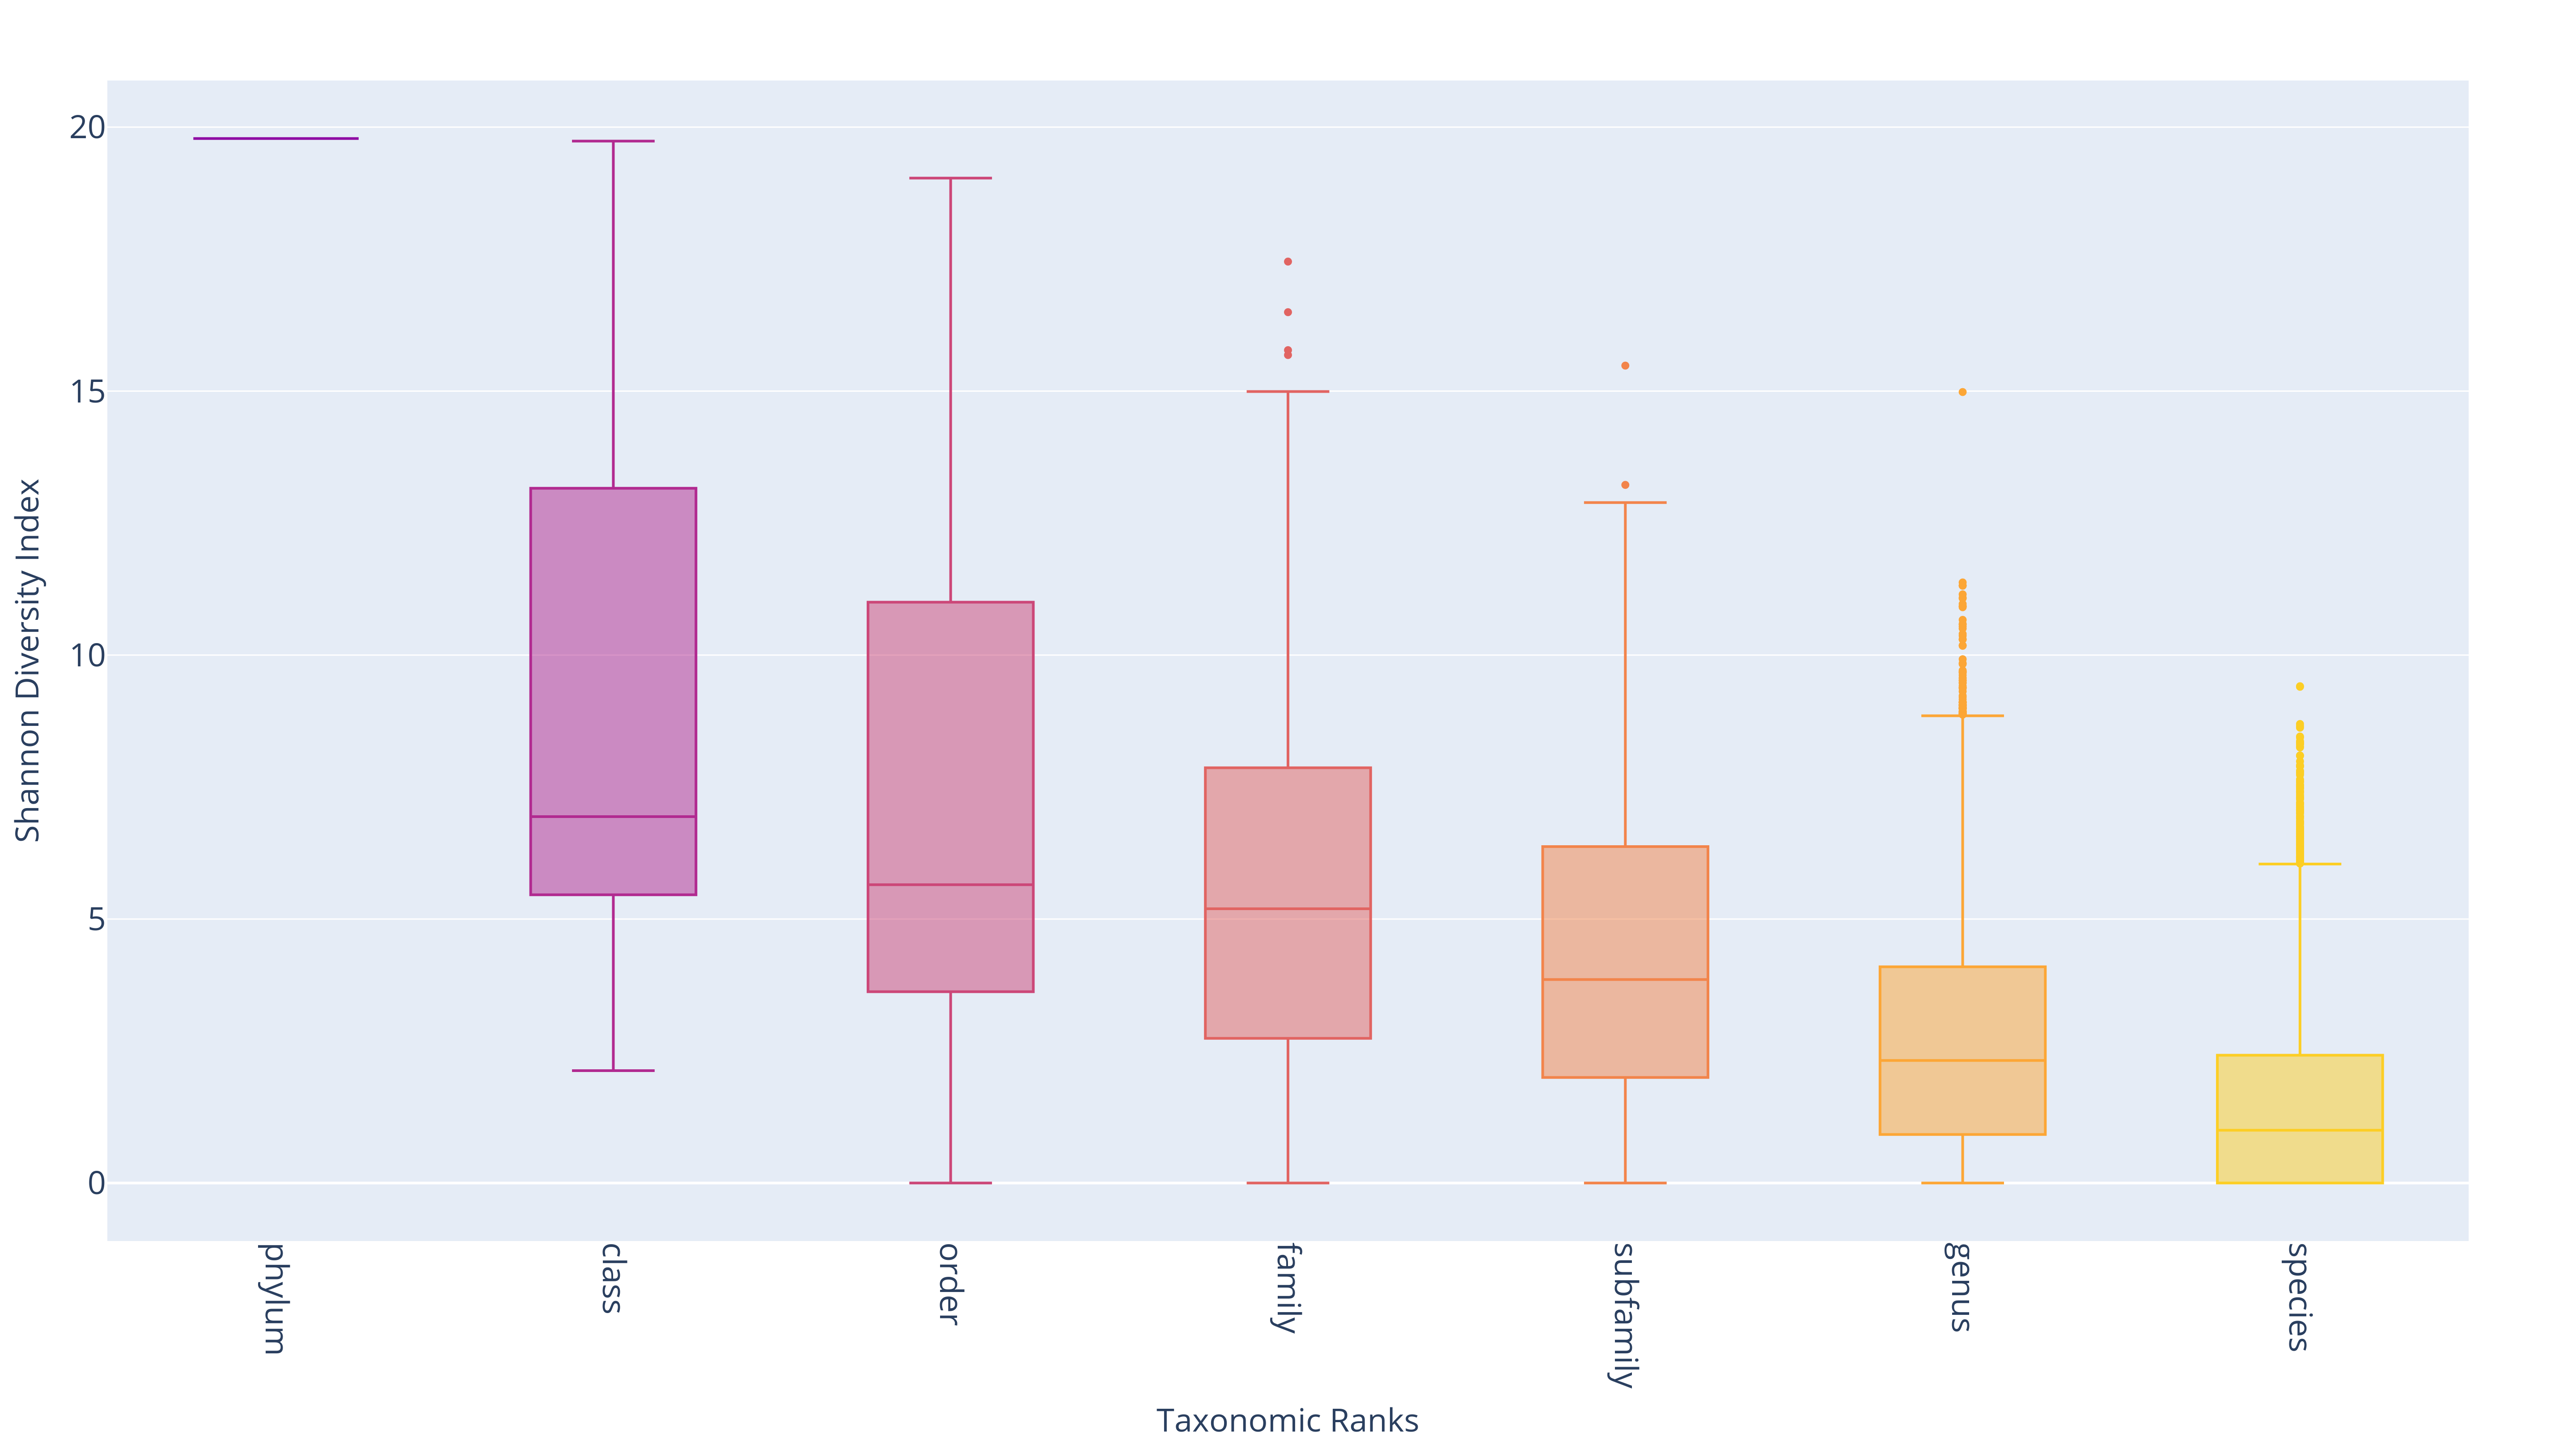
Shannon Diversity Index (SDI)
The Shannon Diversity Index (SDI) quantifies genetic diversity by accounting for both:
- Richness: Number of unique DNA barcode sequences
- Evenness: Distribution of samples across those barcodes
Higher SDI values indicate greater genetic diversity with more evenly distributed barcodes, while lower values suggest dominance by a small number of barcodes.
Definition:
\( \mathrm{SDI}_T = -\sum_{i=1}^{N} p_i \log_2(p_i) \)
- N is the number of unique barcodes in subgroup T
- pi is the proportion of samples with the i-th barcode
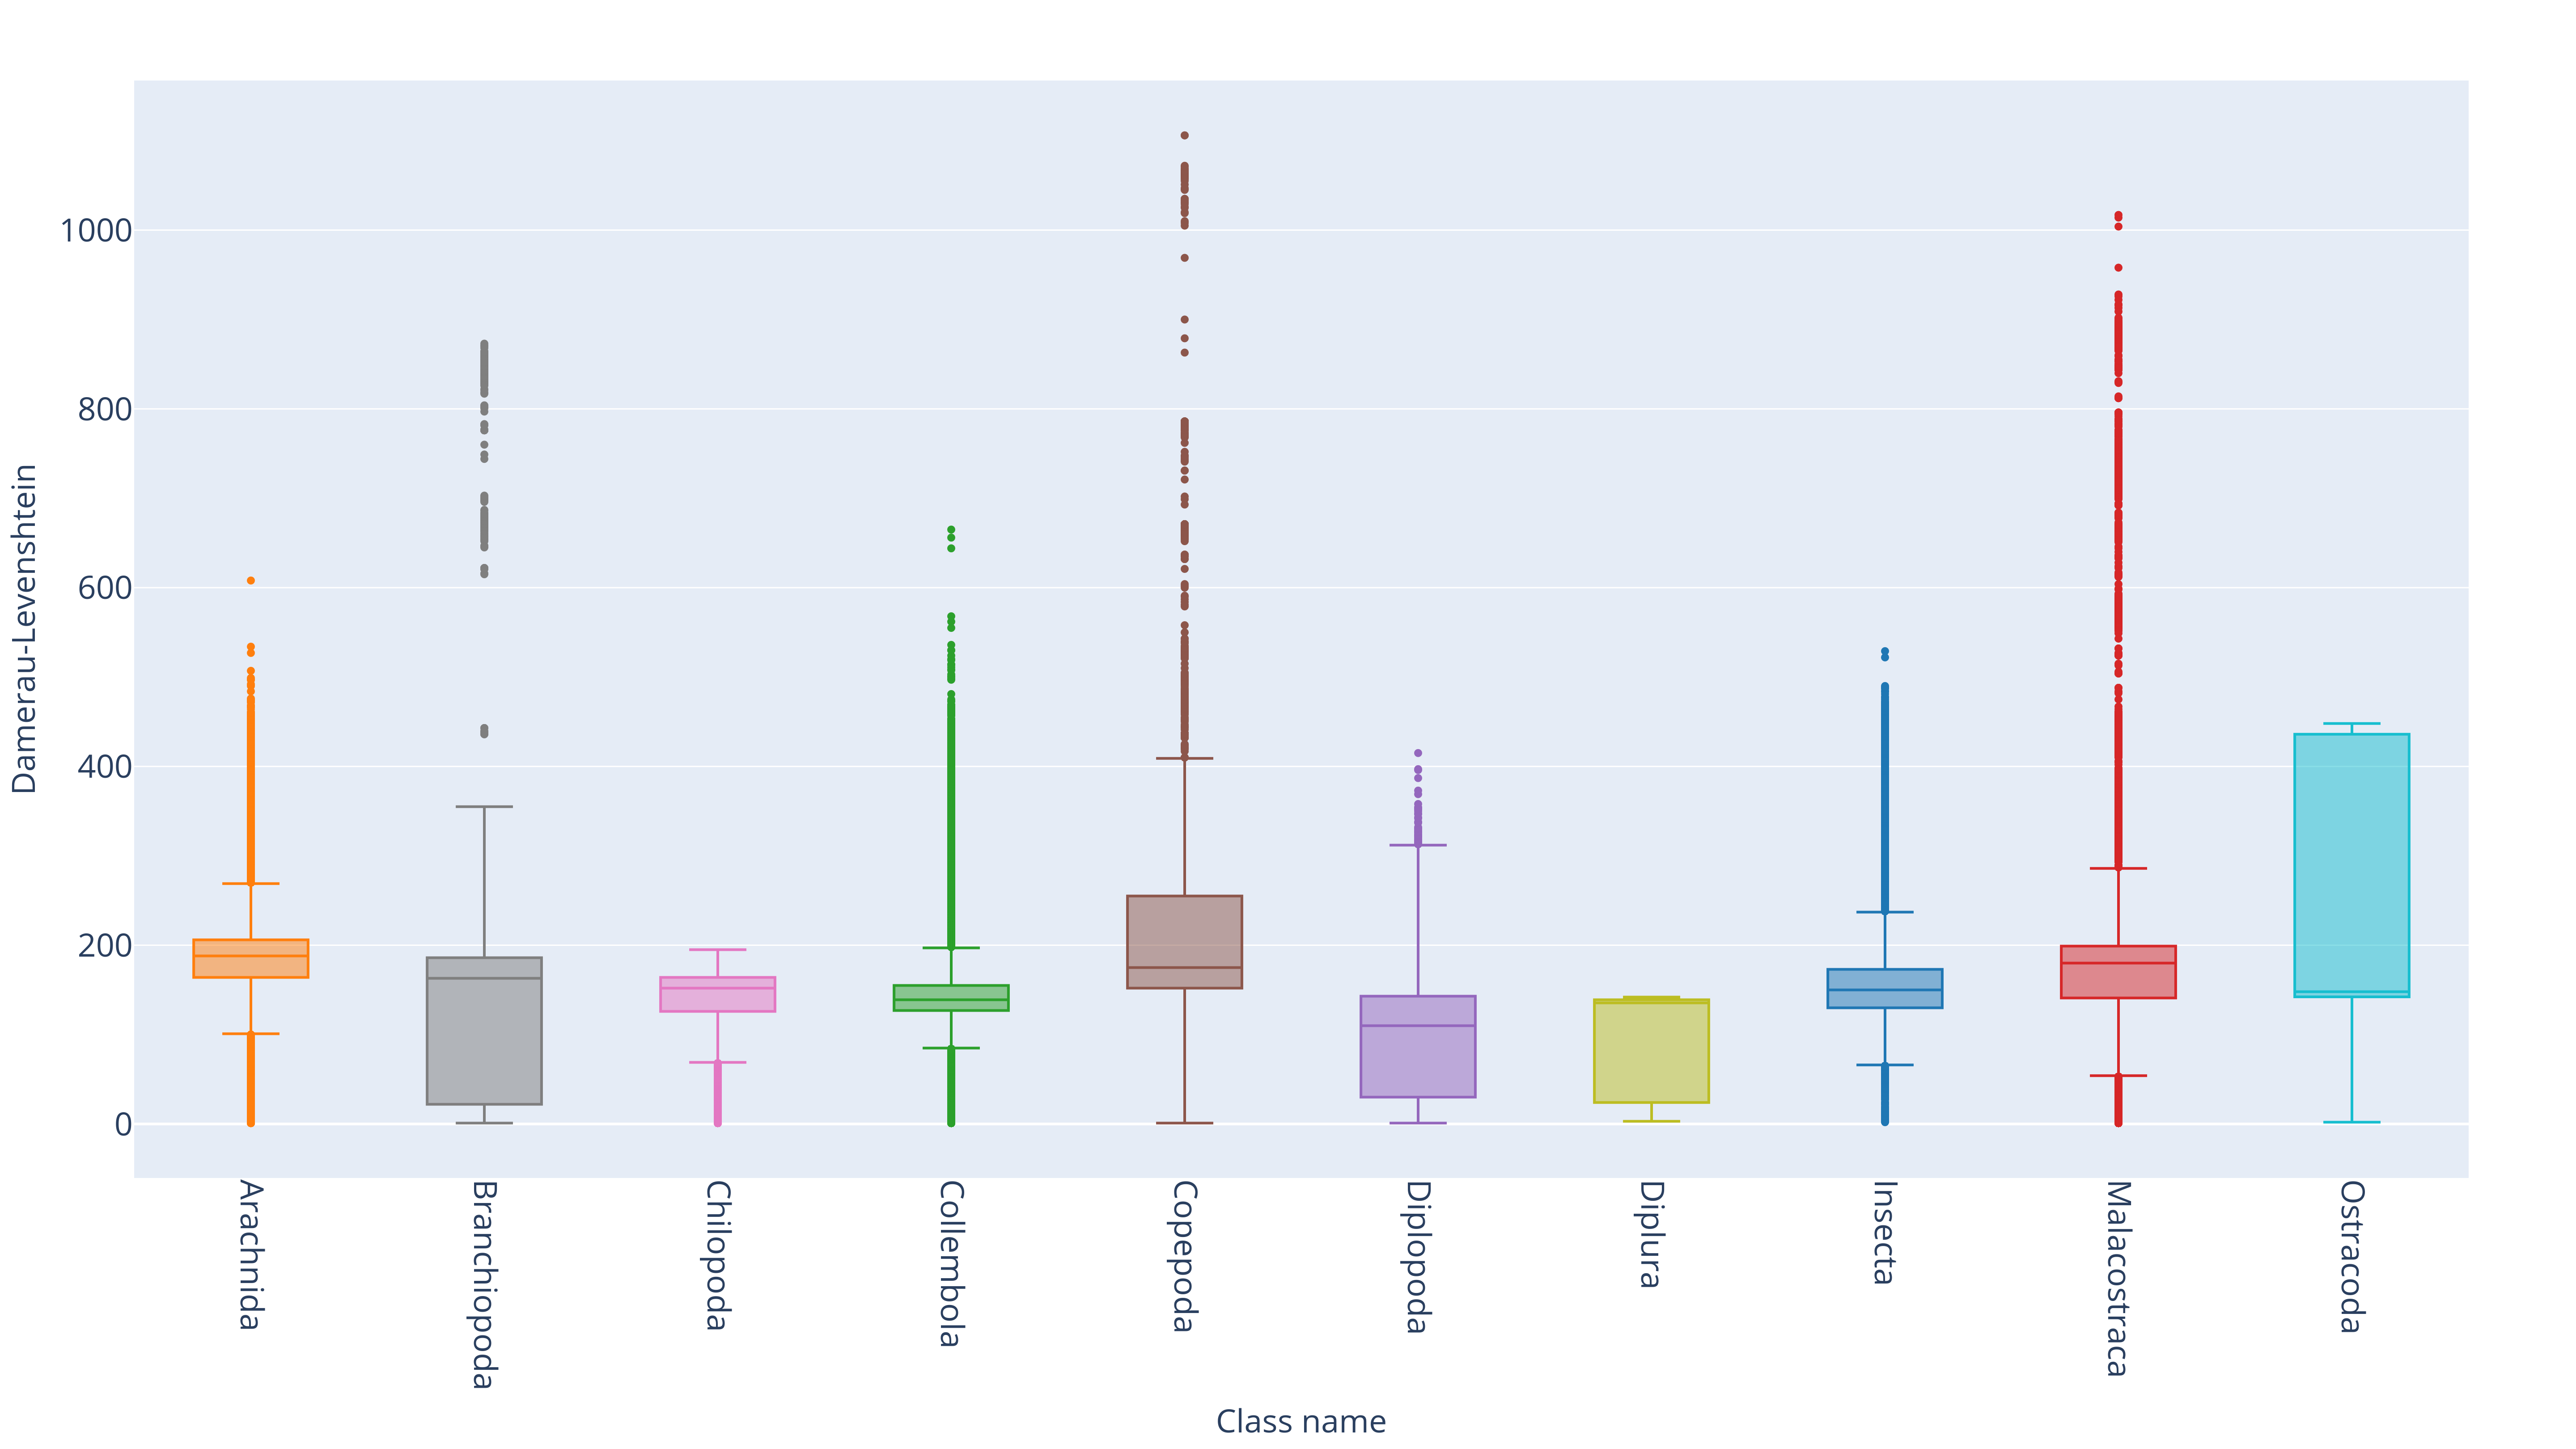
Damerau–Levenshtein Distance for DNA Barcodes
The Damerau–Levenshtein distance measures sequence similarity by counting the minimum number of edit operations—insertions, deletions, substitutions, and adjacent transpositions— required to transform one DNA barcode into another.
Average pairwise distances are computed across taxonomic ranks using the following procedure:
- Subgroups with fewer than 4 unique sequences are excluded
- Subgroups with more than 1,000 sequences are randomly sampled to 1,000
- Sequences are aligned using MAFFT
- Pairwise distances are computed using the Damerau–Levenshtein metric
- Mean and standard deviation are aggregated across subgroups at each taxonomic rank
Pairwise Distance Calculation
The repository provides two implementations for computing pairwise DNA barcode distances:
- Pandas — suitable for small to medium-sized datasets
- Apache Spark (PySpark) — optimized for large-scale datasets such as BIOSCAN-5M
Note: For optimal performance, experiments should be conducted in two phases, selecting the appropriate implementation based on dataset size.
Illustrations
The visualization summarizes the distribution of SDI and pairwise distances across taxonomic ranks. Each boxplot displays the Interquartile Range (IQR)—the range between the 25th percentile (Q1) and the 75th percentile (Q3)—capturing the central 50% of the data. The median (Q2) is shown as a line inside the box. Whiskers extend up to 1.5 times the IQR from Q1 and Q3, indicating data spread and helping to identify potential outliers.
Distributions of SDI across taxonomic ranks
Distributions of pairwise distance across subgroups of class
Distributions of pairwise distance across subgroups of order
