Project Description
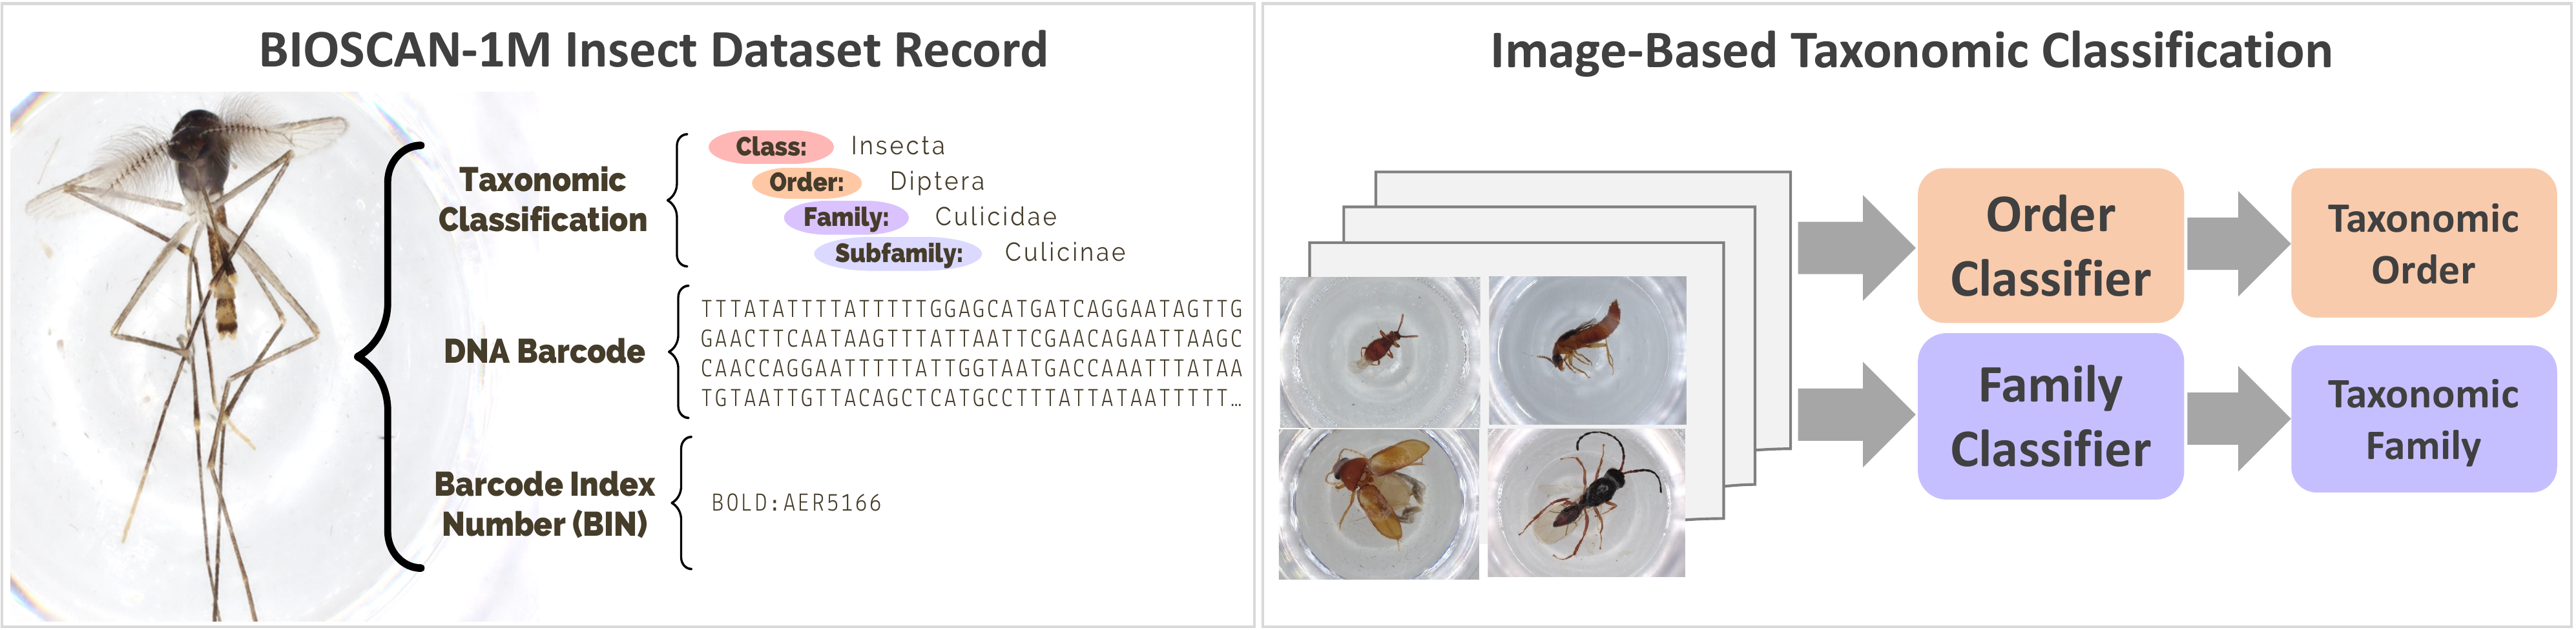
BIOSCAN-1M is a large-scale dataset combining over 1 million RGB microscopic images with metadata such as DNA barcode sequences and taxonomy. It supports biodiversity and AI research through multimodal learning.
Key Contributions
- Led dataset design and governance, defining taxonomy-aware sampling strategies and class-balanced, stratified splits for small, medium, and large dataset variants.
- Developed robust ETL pipelines for large-scale image preprocessing (cropping, resizing, HDF5 conversion) and metadata structuring (CSV, JSON-LD) to support downstream ML tasks.
- Implemented and automated the full ML pipeline, from data preparation through model training and benchmarking, using cloud-hosted storage and reproducible configurations.
- Fine-tuned ResNet50 and Vision Transformer (ViT) backbones using transfer learning for multi-class classification, evaluating model performance across 72 controlled experiments.
- Benchmarked classification models with systematic variation of task type, architecture, loss function, and random seed to assess robustness and generalization.
- Ensured reproducibility and experimental rigor through repeated runs and standardized evaluation metrics, including accuracy, F1-score, confusion matrices, and tabular summaries.
Tools & Technologies
- Python, PyTorch, Pandas, NumPy
- h5py, CSV, JSON, Pickle, Hugging Face Datasets
- Google API Client, PyDrive, Requests, google-auth
- Transformers (e.g., ViT, DetrFeatureExtractor), timm
- OpenCV, scikit-learn, PIL (Pillow)
- Matplotlib, Seaborn, Plotly
- Cluster Computing, Parallel Computation
- Virtual Environment, Bash Environment
- Digital Research Alliance of Canada
Code / Git
Research / Paper
Presentations
Links & Resources
Additional Context
Statistical Analysis
Fine-Grained Classification
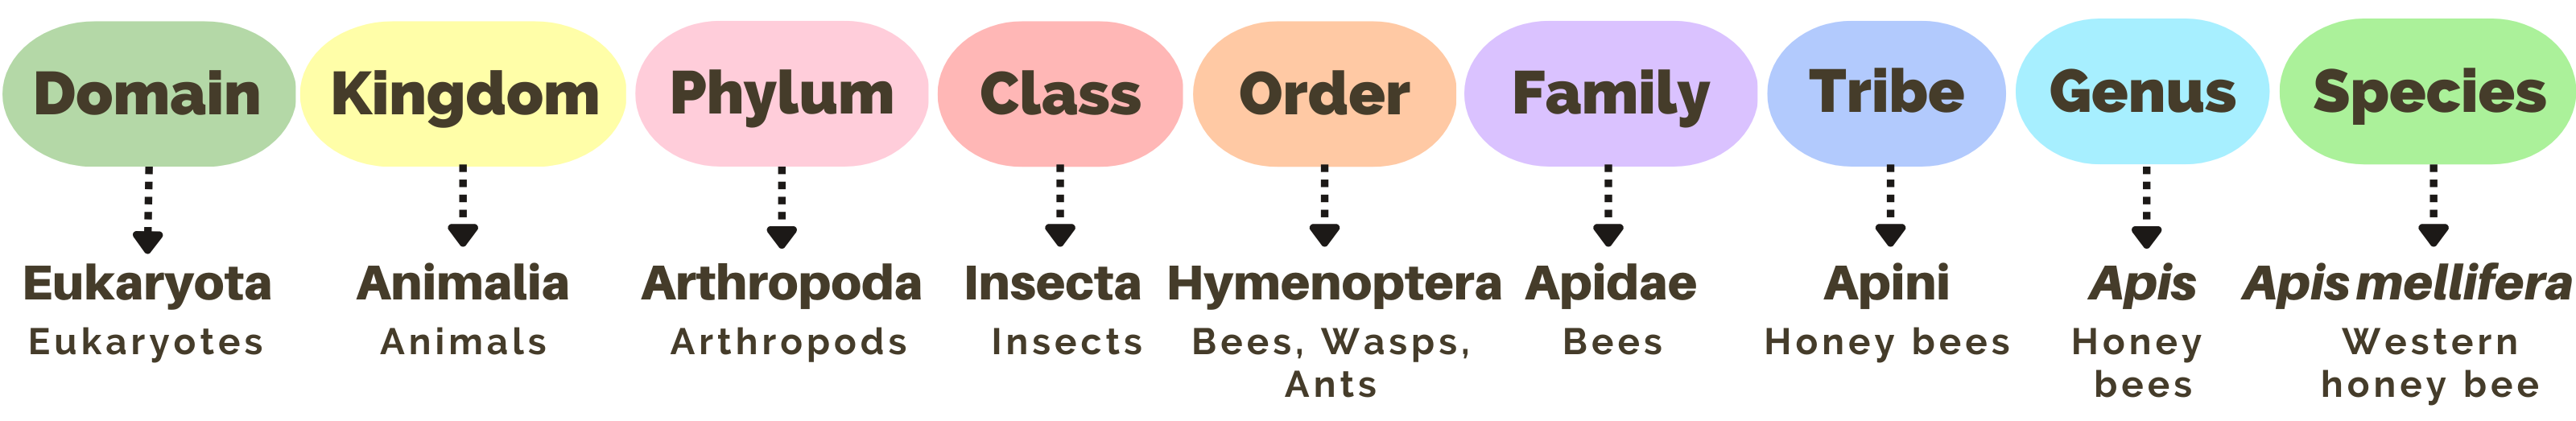
Fine-grained classification involves distinguishing between classes that are very similar to each other, often requiring detailed and nuanced feature analysis. In taxonomic classification, this concept is illustrated as we move from broader, less specific levels (e.g., phylum, class) to more specific levels (e.g., genus, species) within the taxonomic tree. This necessitates a classification model that can accurately differentiate between these closely related classes.
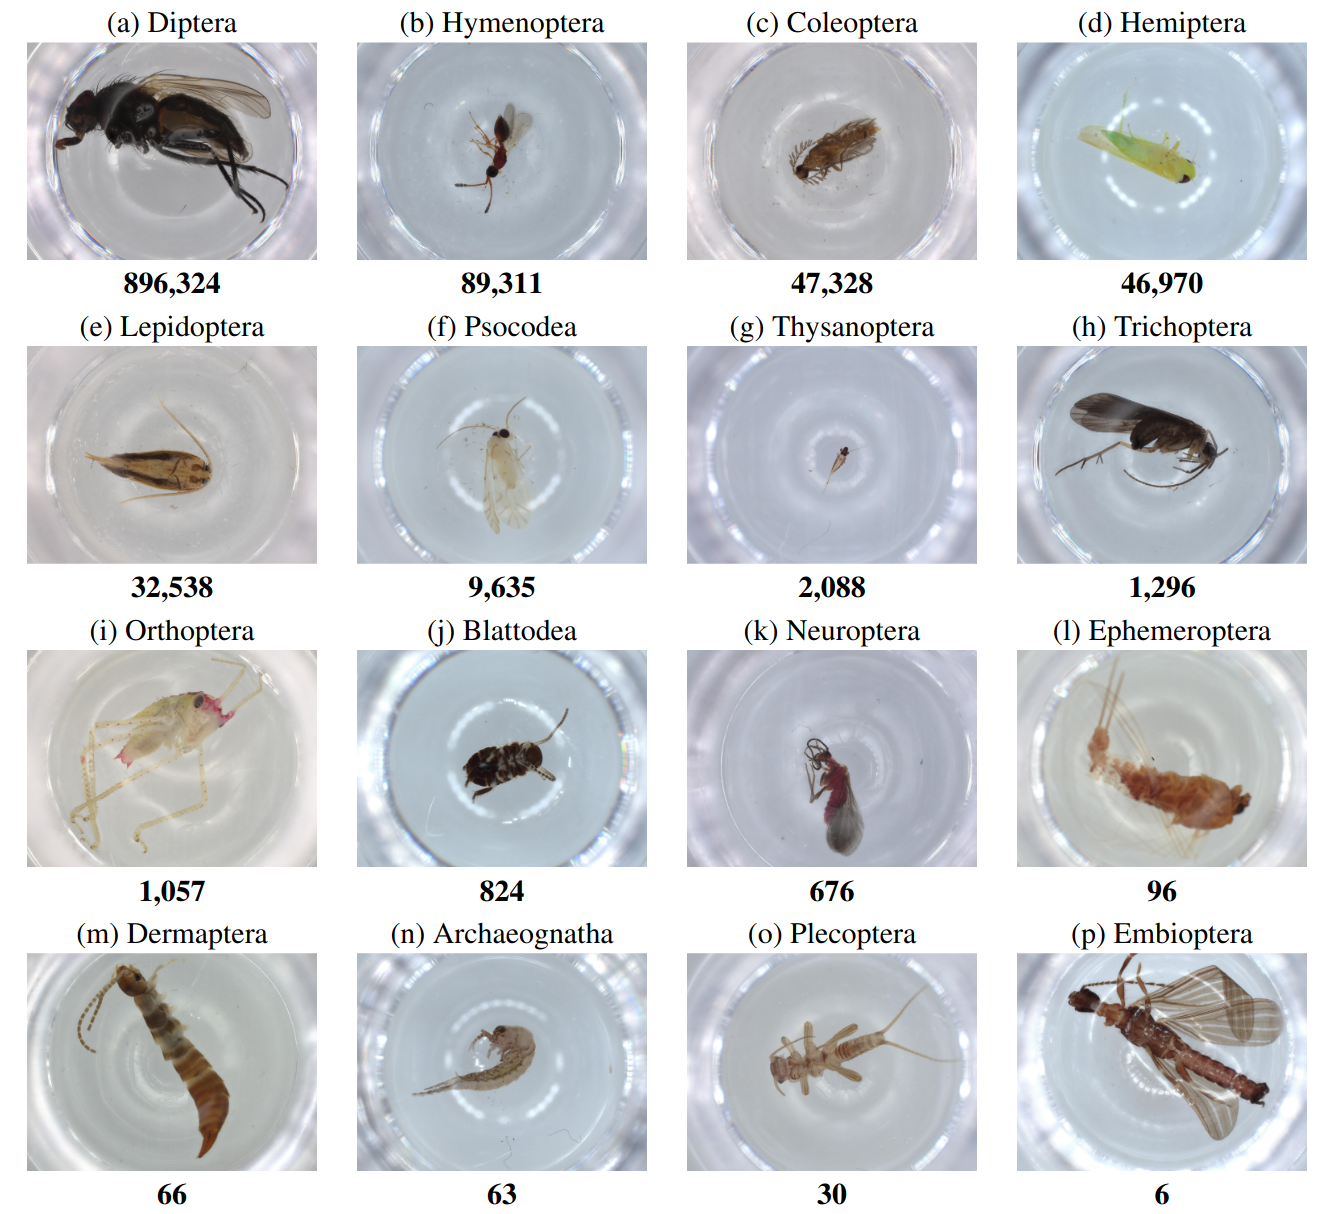
Long-Tailed Distribution
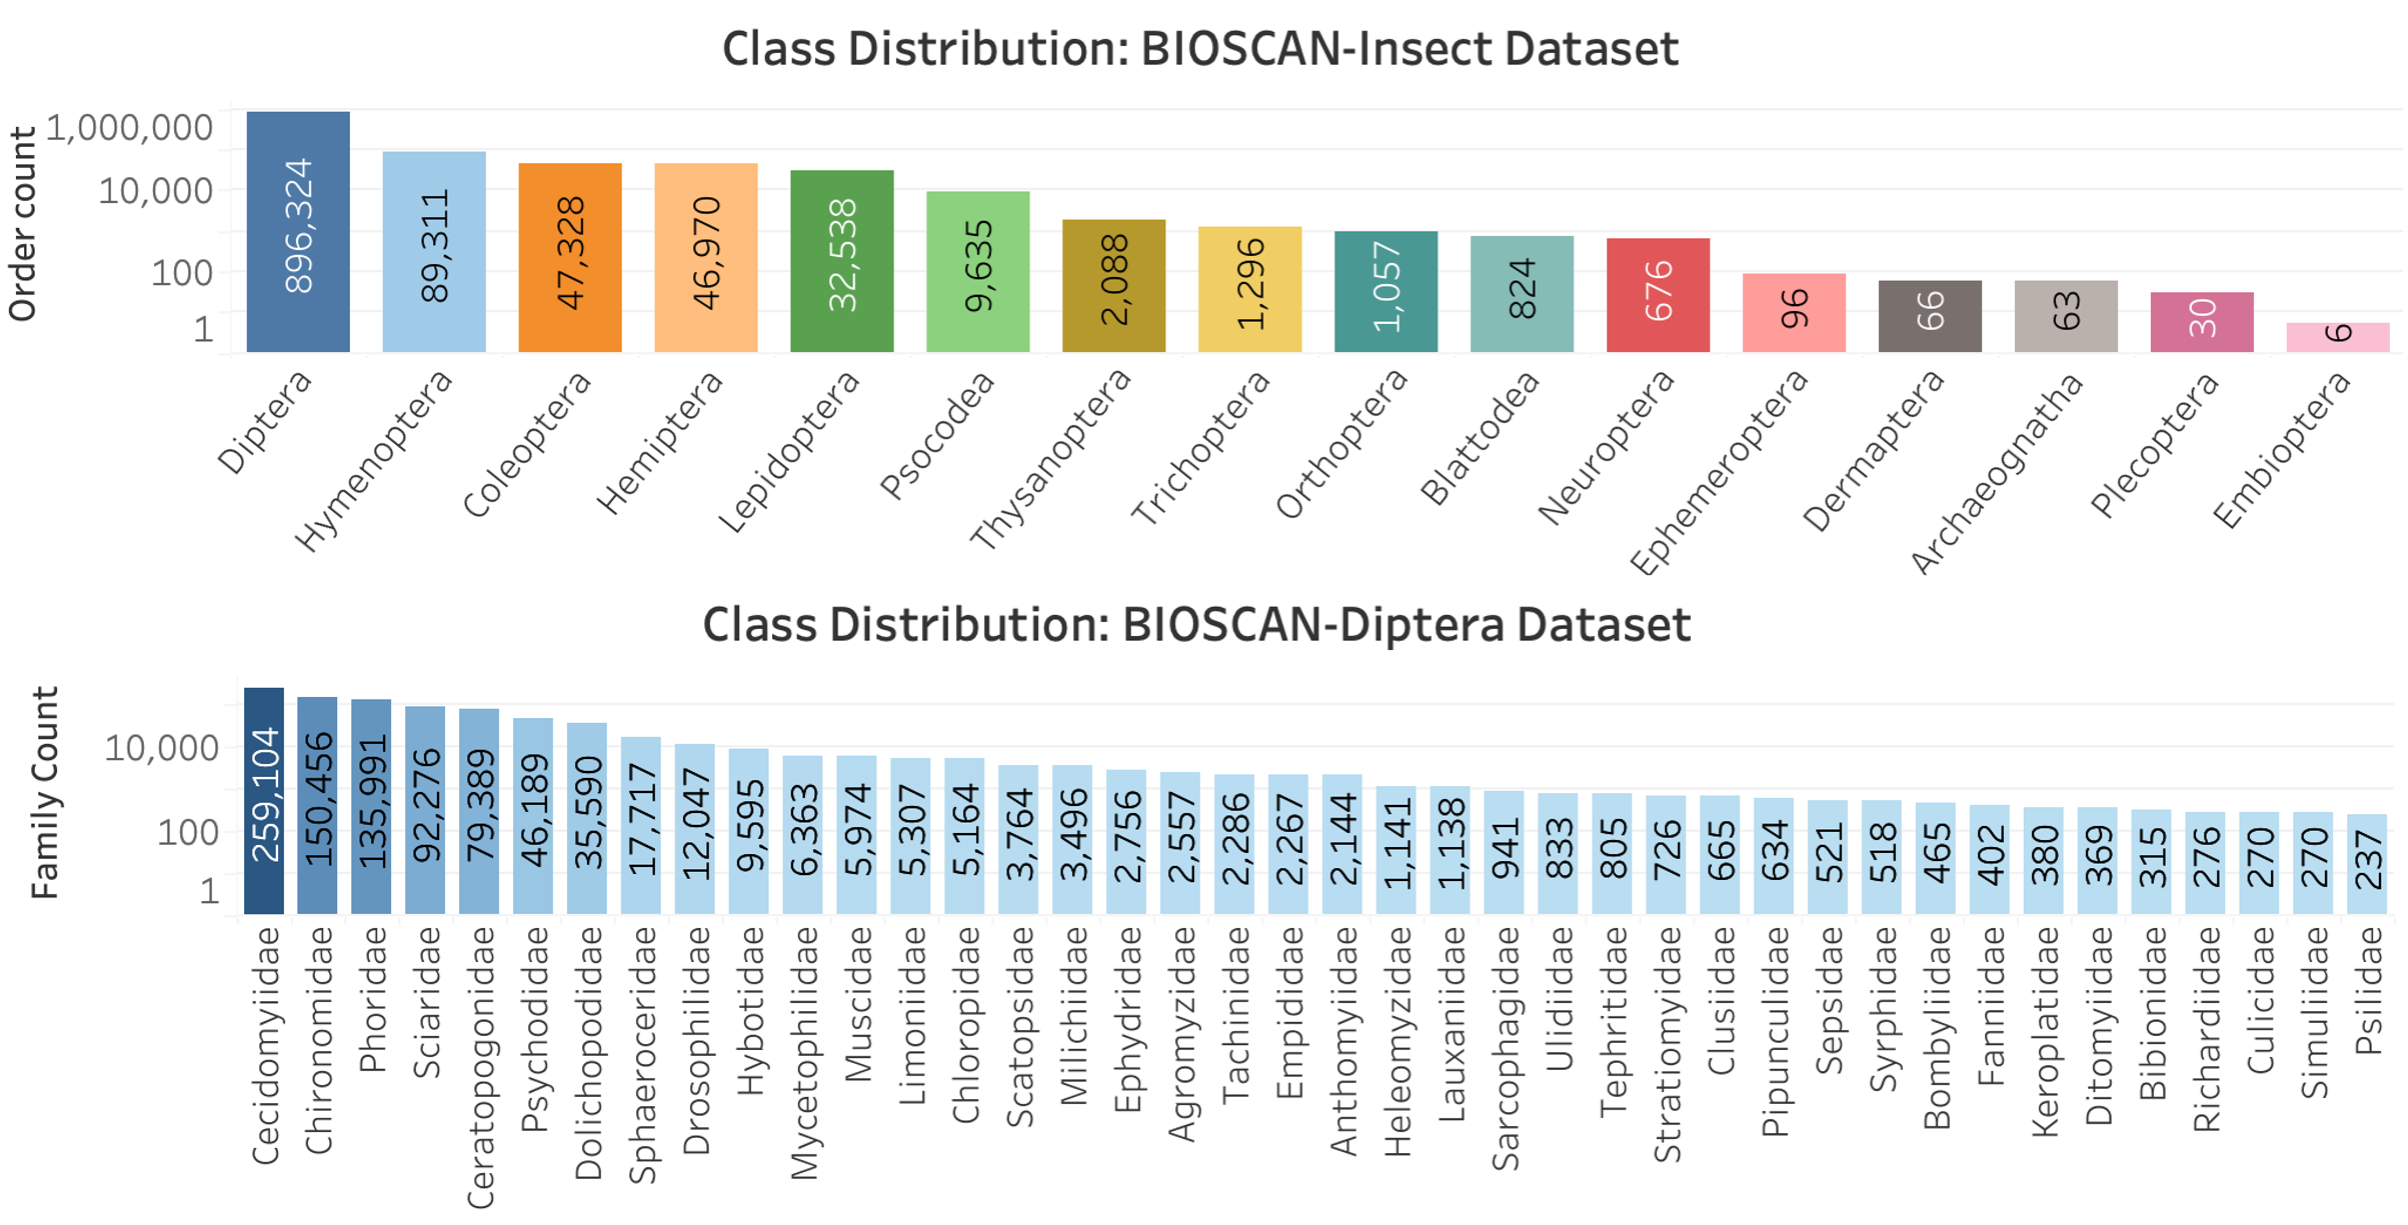
The BIOSCAN-1M dataset exhibits a long-tailed distribution, where a small number of classes have a large number of samples, while most classes have very few samples. This distribution can result in models that perform well on the frequently occurring classes but struggle with the underrepresented classes due to insufficient training data. For instance, in the BIOSCAN-1M dataset, the order Diptera contains 896,324 samples out of a total of 1,128,313, which represents approximately 80% of all samples. This illustrates how a few classes dominate the dataset, highlighting the long-tailed nature of the distribution.
High Class Imbalance Ratio
There is a significant class imbalance in the BIOSCAN-1M dataset, with some classes being heavily underrepresented compared to others. This high class imbalance ratio can lead to biases in model training, where the model becomes skewed towards the majority classes and shows poor performance on the minority classes. Addressing this imbalance is crucial for ensuring the model's effectiveness across all classes.
ML Benchmarks
This section outlines the machine learning benchmark tasks and results for the BIOSCAN-1M dataset. The benchmarks were designed to evaluate classification performance at different taxonomy levels and dataset sizes.
Data Sampling
The BIOSCAN-1M dataset was sampled in the following ways:
- BIOSCAN-1M-Insect: Samples at the taxonomy order level.
- BIOSCAN-1M-Diptera: Samples at the taxonomy family (Diptera) level.
- Small: 50,000 samples
- Medium: 200,000 samples
- Large:
- Order: 1,100,000 samples
- Diptera: 891,000 samples
Taxonomy Levels: Two datasets were created:
Dataset Sizes: Each dataset was further divided into three sizes to address usability and feasibility for end users in various domains:
Stratified Class-Based Split
Data samples for each dataset size were split into train (70%), validation (10%), and test (20%) sets using a class-based mechanism to ensure consistent data distributions across all sets.
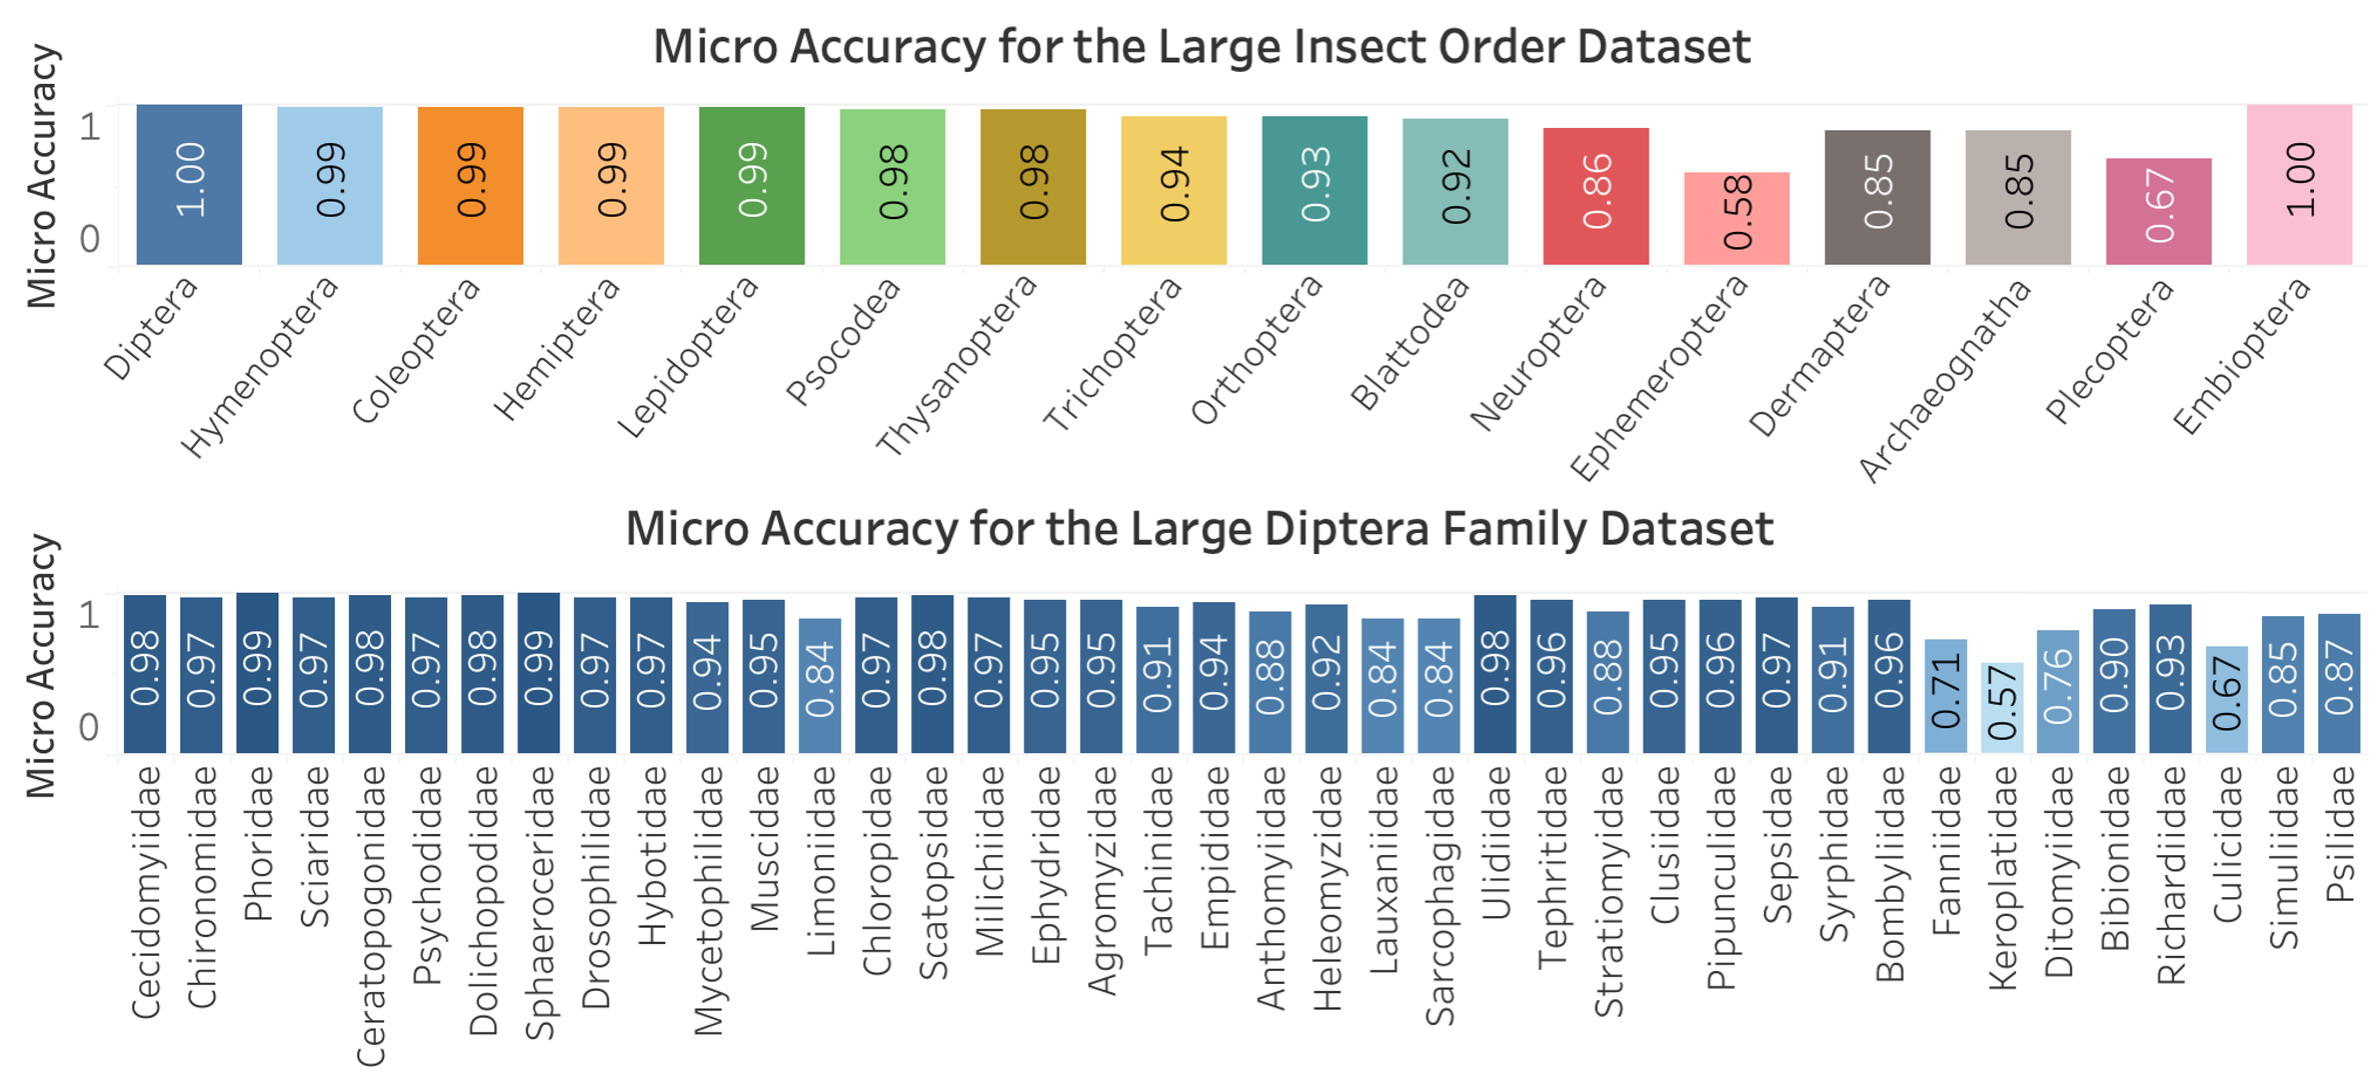
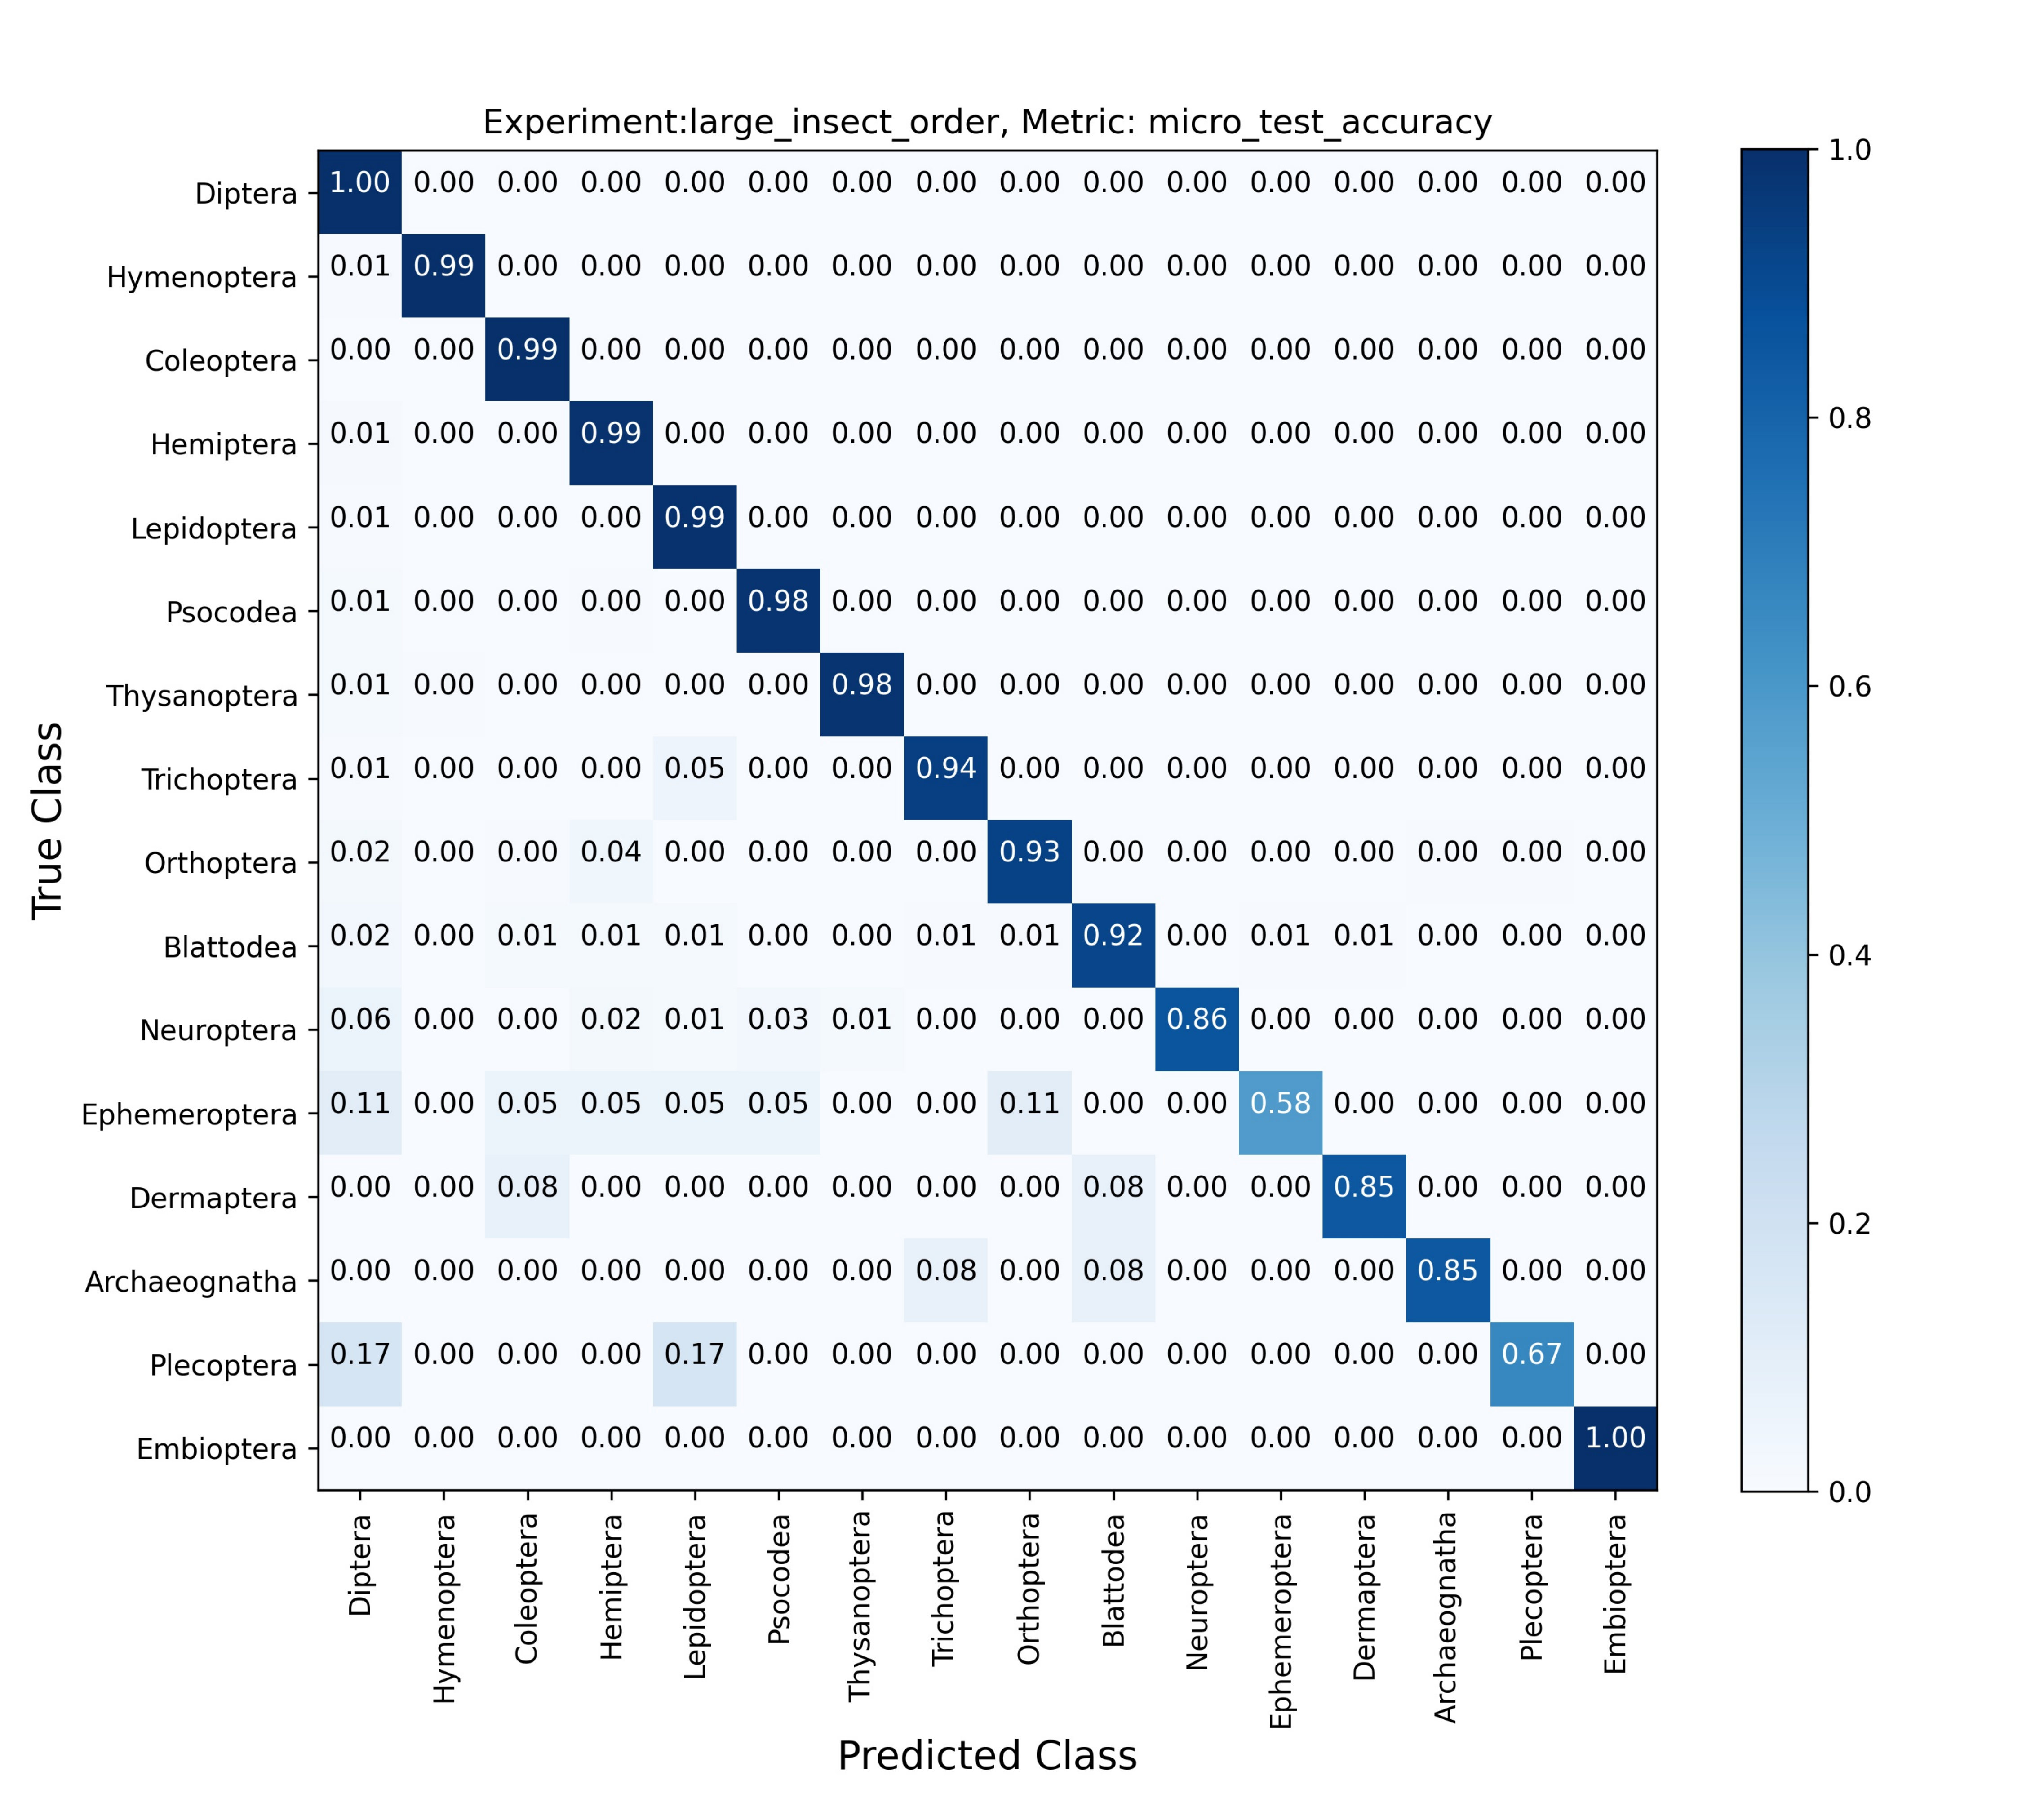
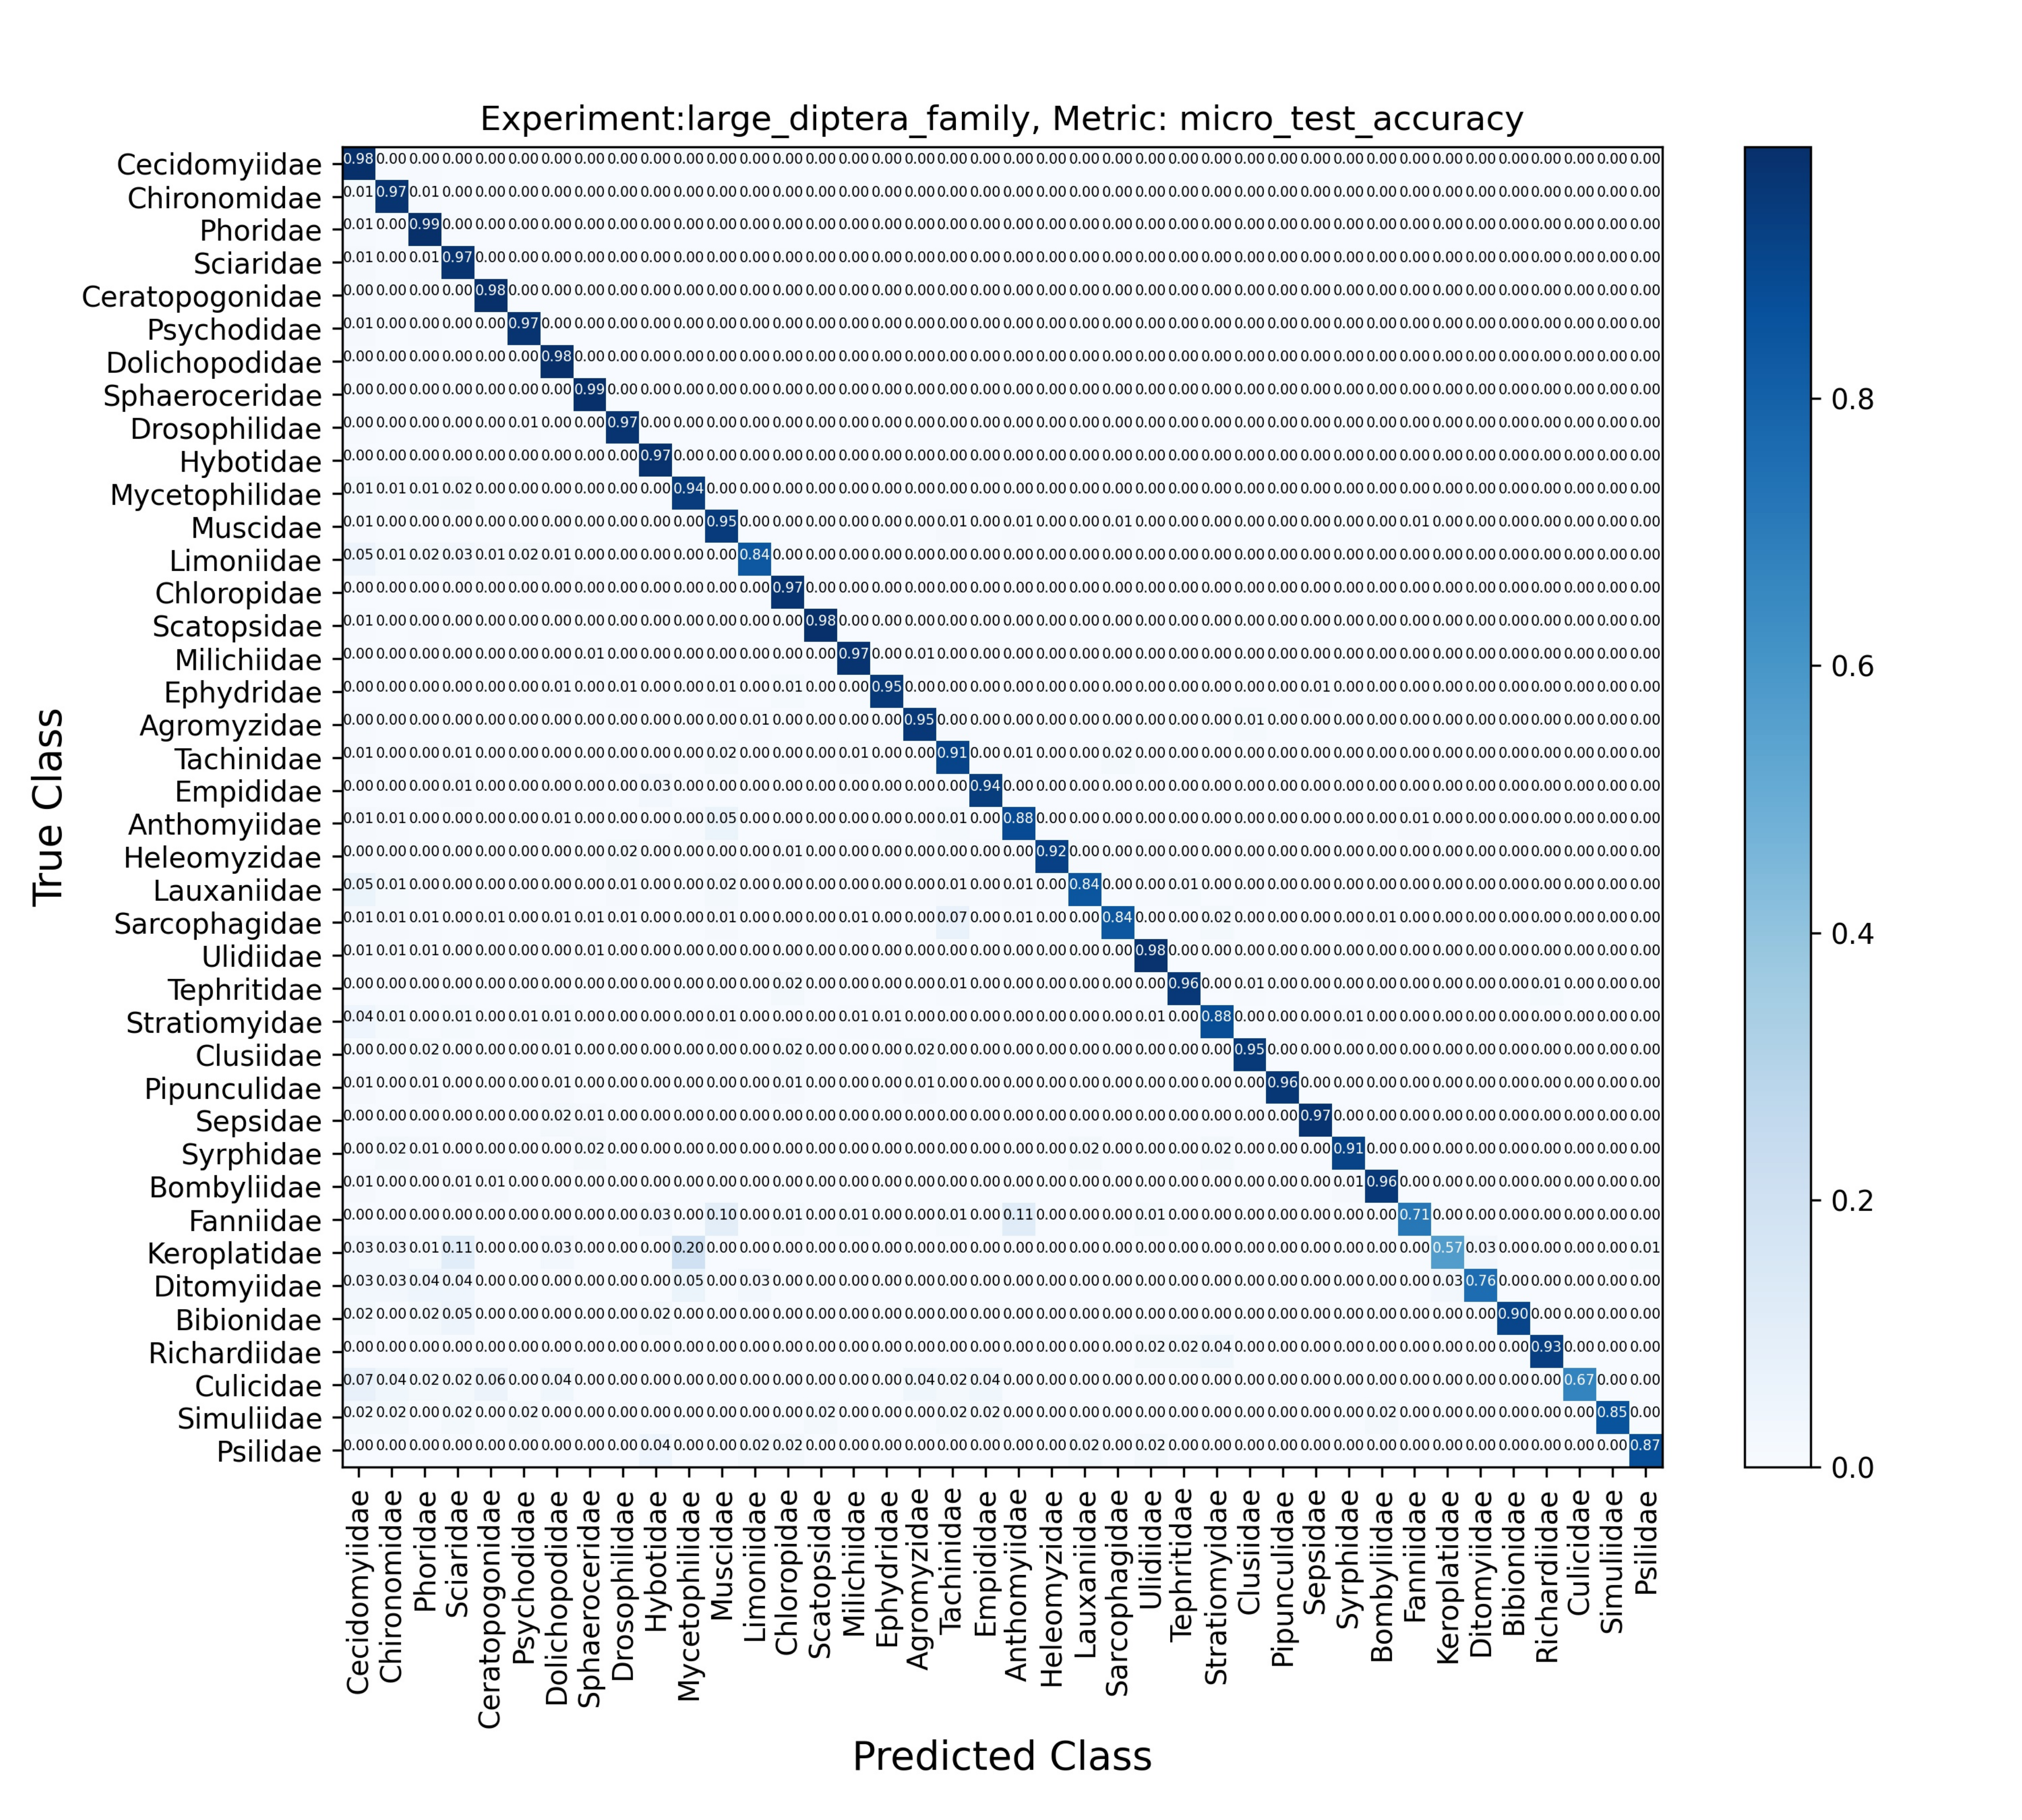
Multi-class Classification
Two image-based classification benchmark experiments were designed and conducted on all three sized datasets:
- Insect-Order: 16 classes.
- Family-Diptera: 40 classes.
Transfer Learning
Dataset was fine-tuned utilizing two pretrained backbone models to facilitate transfer learning:
- ResNet50: A deep residual learning framework for image recognition. He et al. (2016)
- Vision Transformer (ViT-B/16-224): A transformer-based model for image classification. Dosovitskiy et al. (2020)
Robustness and Generalizability
To ensure the robustness and generalizability of the models, each experiment was repeated with 3 different random seeds. This approach allows us to account for the impact of randomness in our results. The total number of experiments conducted is given by:
3 (dataset sizes) × 2 (classification tasks) × 2 (backbone models) × 2 (loss functions) × 3 (seeds) = 72
To see the results these experiments with mean and standard deviation please visit Tables A3-A4 Gharaee et al. (2023).
Evaluation
The model with the best performance on the validation set is selected and used for test experiments. The metrics used for the evaluation are as follows:
- Top-1 Accuracy: The proportion of test samples where the top predicted class matches the true label.
- Top-5 Accuracy: The proportion of test samples where the true label is among the top five predicted classes.
- Macro-F1 Score: The macro-averaged F1 score, which computes the F1 score for each class and then averages these scores, giving equal weight to each class.
- Loss: Monitored during training and evaluated post-training to measure the effectiveness of the model’s learning.
Findings and Results
The results indicate that:
- Cross-Entropy: Generally performed better achieving higher accuracy.
- Vision Transformer: Demonstrated competitive performance, especially on larger datasets, showing its robustness and capability in handling high-dimensional image data.
Deployment
The model trained on BIOSCAN-1M datasets are stored in project's Google Drive folder. The pretrained models, and its AI-based tool are utilized by biologists at the Centre for Biodiversity Genomics (CBG) to streamline biological taxonomy classification. Traditionally performed by human experts, this process is costly, and time-consuming.