Project Description

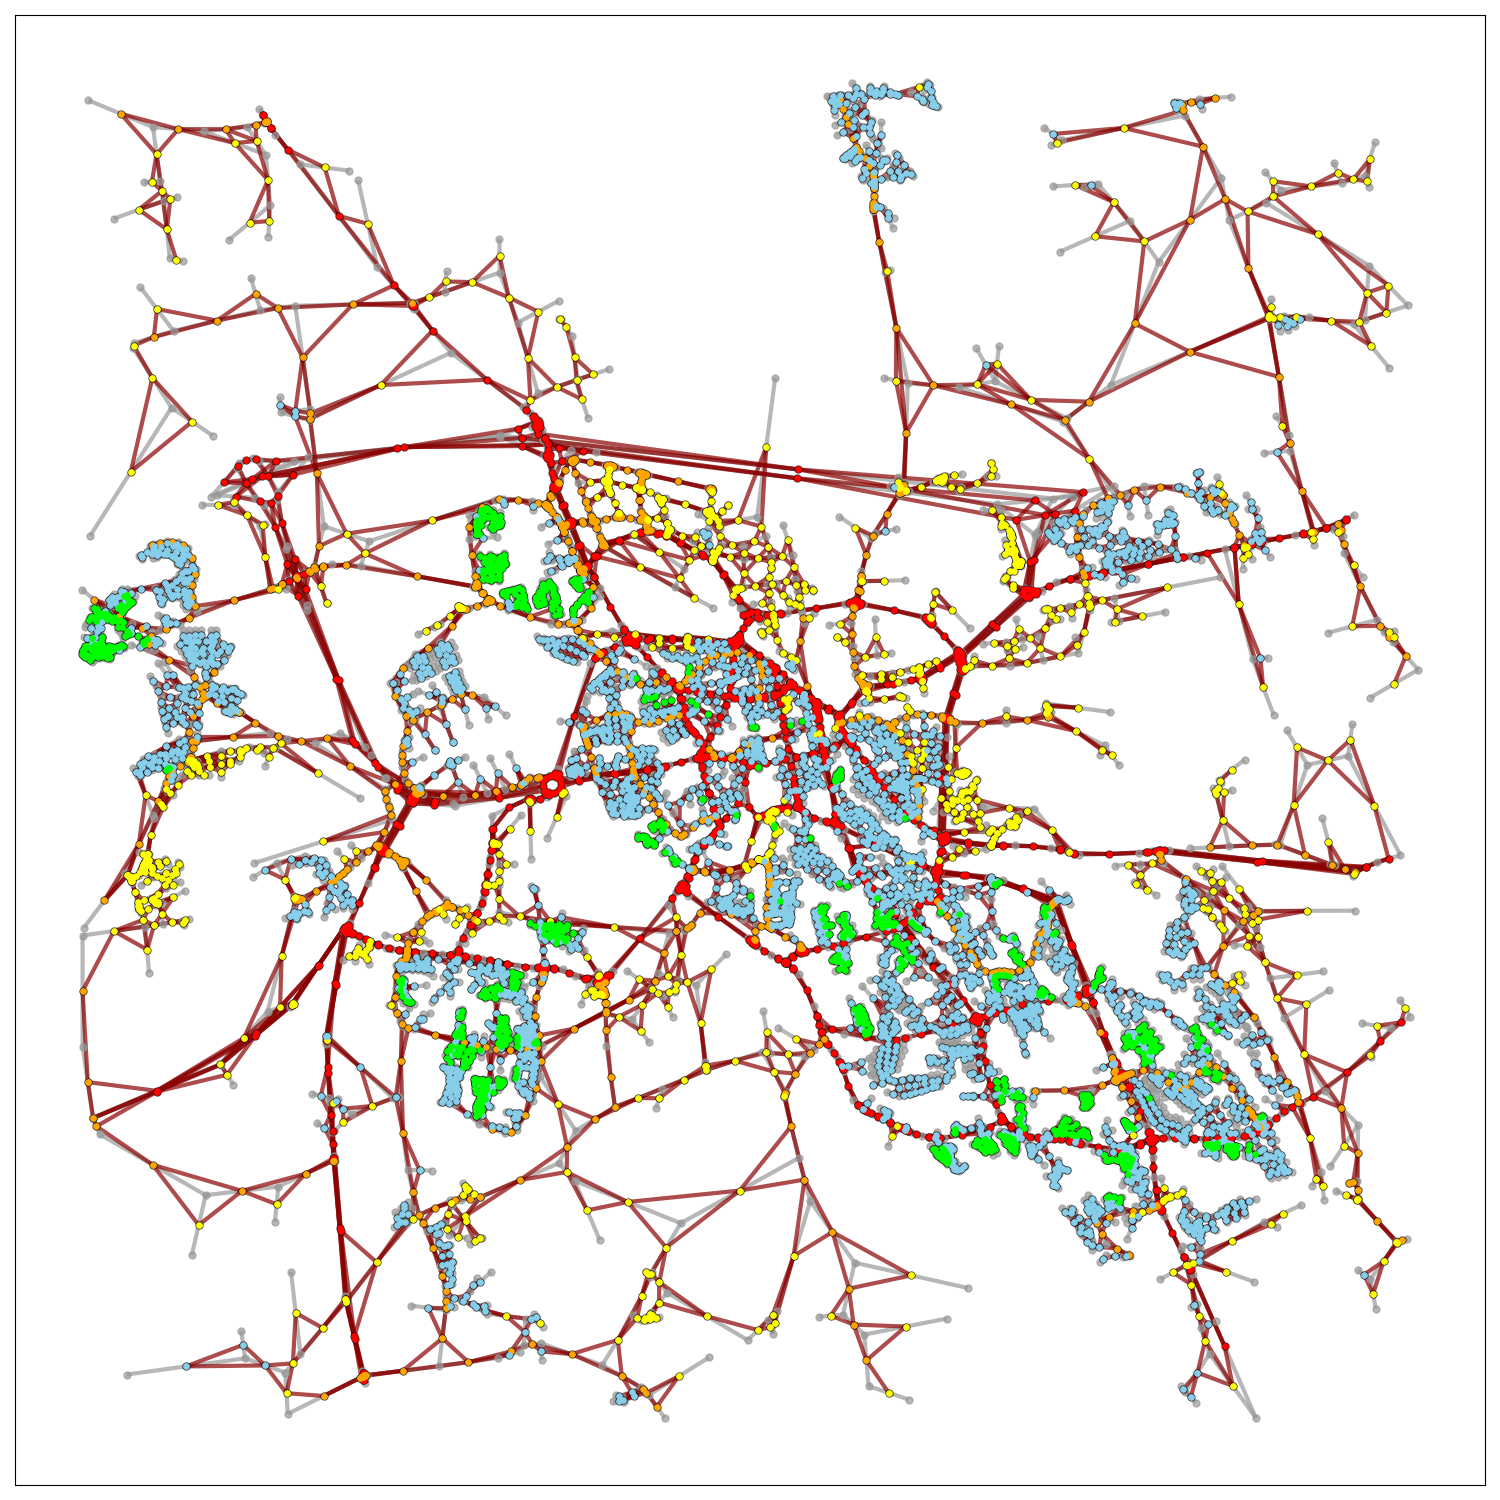
In this project, we propose a novel learning-based approach, GAIN, for graph representations of road networks. GAIN is applied to a realistic graph dataset composed of road networks from 17 Swedish cities, sourced from OpenStreetMap (OSMnx).
Key Contributions
- Co-led a cross-industry collaborative research project with SCANIA, aligning academic innovations with real-world challenges in urban mobility and infrastructure.
- Curated and preprocessed a large-scale vector-space road network dataset from OpenStreetMap for 17 Swedish cities.
- Conceptualized and implemented a novel graph learning framework for road type classification in complex urban environments.
- Initiated and evaluated graph transformations and sampling strategies under transductive and inductive learning settings to improve model generalization across diverse urban layouts.
- Designed the full system architecture and led the end-to-end development, experimentation, and evaluation pipeline.
- Executed an exhaustive grid search on a compute cluster to identify optimal model configurations for transductive and inductive tasks.
- Mentored a PhD student, guiding research direction, methodology, and publication, with shared authorship in a peer-reviewed article (Stromann, O. 2022).
- Presented technical results in regular meetings with industry partner, SCANIA and communicated results to both academic and industrial stakeholders.
- Drove the research dissemination process, resulting in a peer-reviewed publication in Pattern Recognition.
Tools & Technologies
- Python, TensorFlow, Numpy
- OSMnx
- OpenCV, scikit-learn
- Matplotlib, Seaborn, Plotly
- NetworkX
- Shapely
- Container (Singularity, Docker)
- Cluster Computing, Parallel Computation
- Virtual Environment, Bash Environment
- Swedish National Infrastructure for Computing (SNIC)
Code / Git
Research / Paper
Presentations
- Vision and Image processing Lab (VIP) Dept. of System Design Engineering University of Waterloo
- Computer Vision Lab (CVL) Dept. of Electrical Engineering University of Linköping
Additional Context
Road Network Graphs
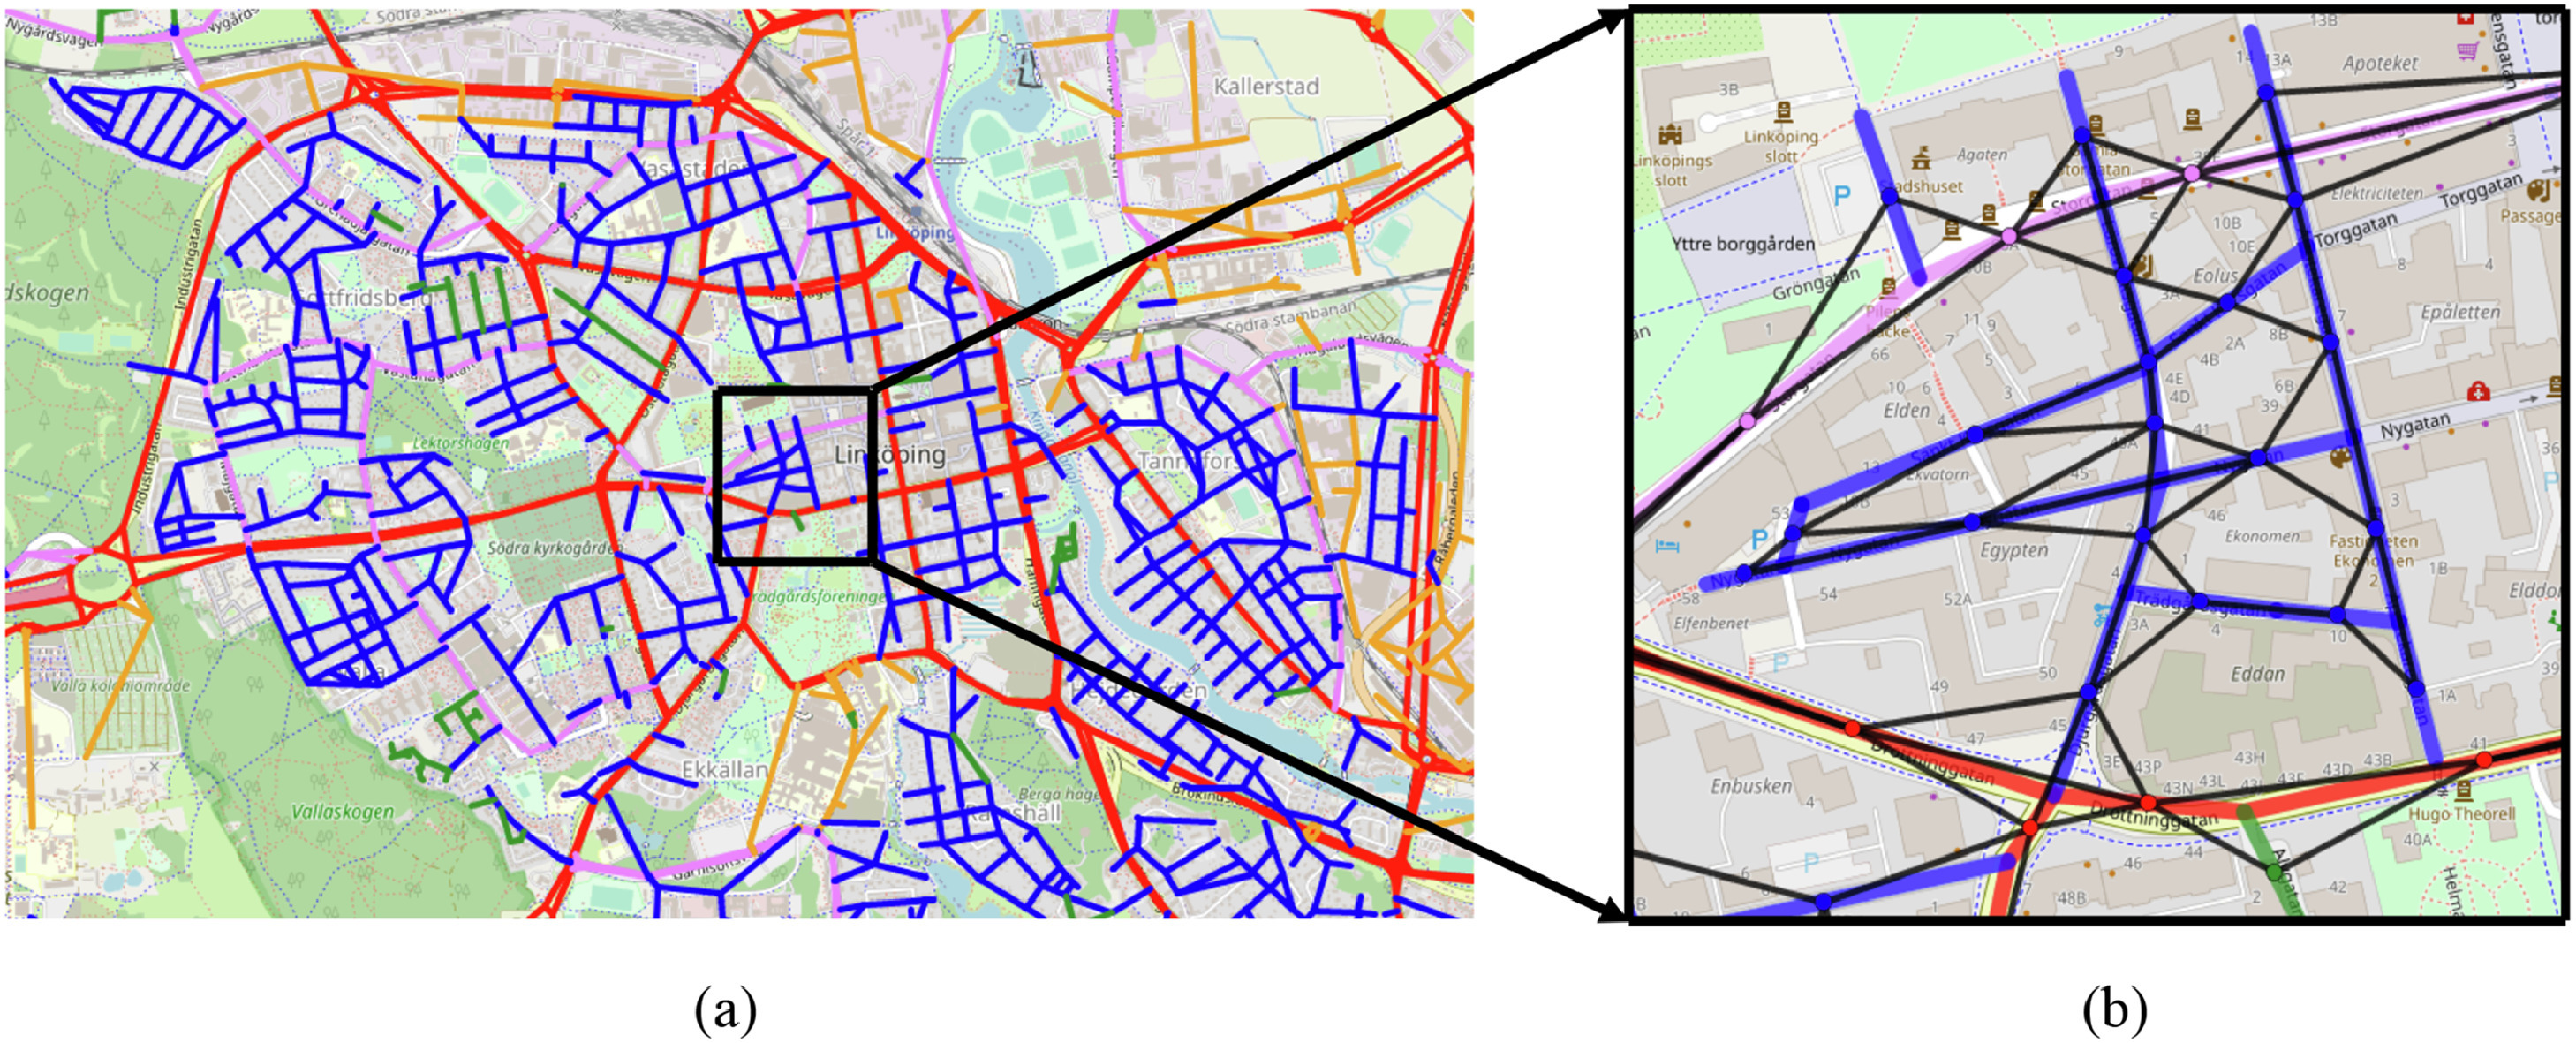
We utilized Open Street Map (OSMnx) Geoff Boeing (2017), which is a powerful Python library designed for the easy collection, creation, and analysis of road networks, and it caters to various needs in urban studies and transportation planning.
- Geospatial Data: OSMnx primarily deals with geospatial data. It uses geographic coordinates (latitude and longitude) to represent the location of streets, buildings, and boundaries. The data is spatially referenced and can be visualized on maps.
- Graph Data: The street network data is represented as graphs, where nodes represent intersections or endpoints, and edges represent streets or road segments. This graph-based representation is useful for network analysis and route optimization.
- Vector Space: OSMnx does not work with RGB (color) data or remote sensing data. Instead, it focuses on vector data related to street networks.
Line Graph
Line graph transformation is a concept used in graph theory and network analysis. It involves converting a given graph into its line graph, which provides a different perspective on the relationships between the graph’s edges. Line graph's vertices represent edges of the original graph and its edges represent shared vertices.
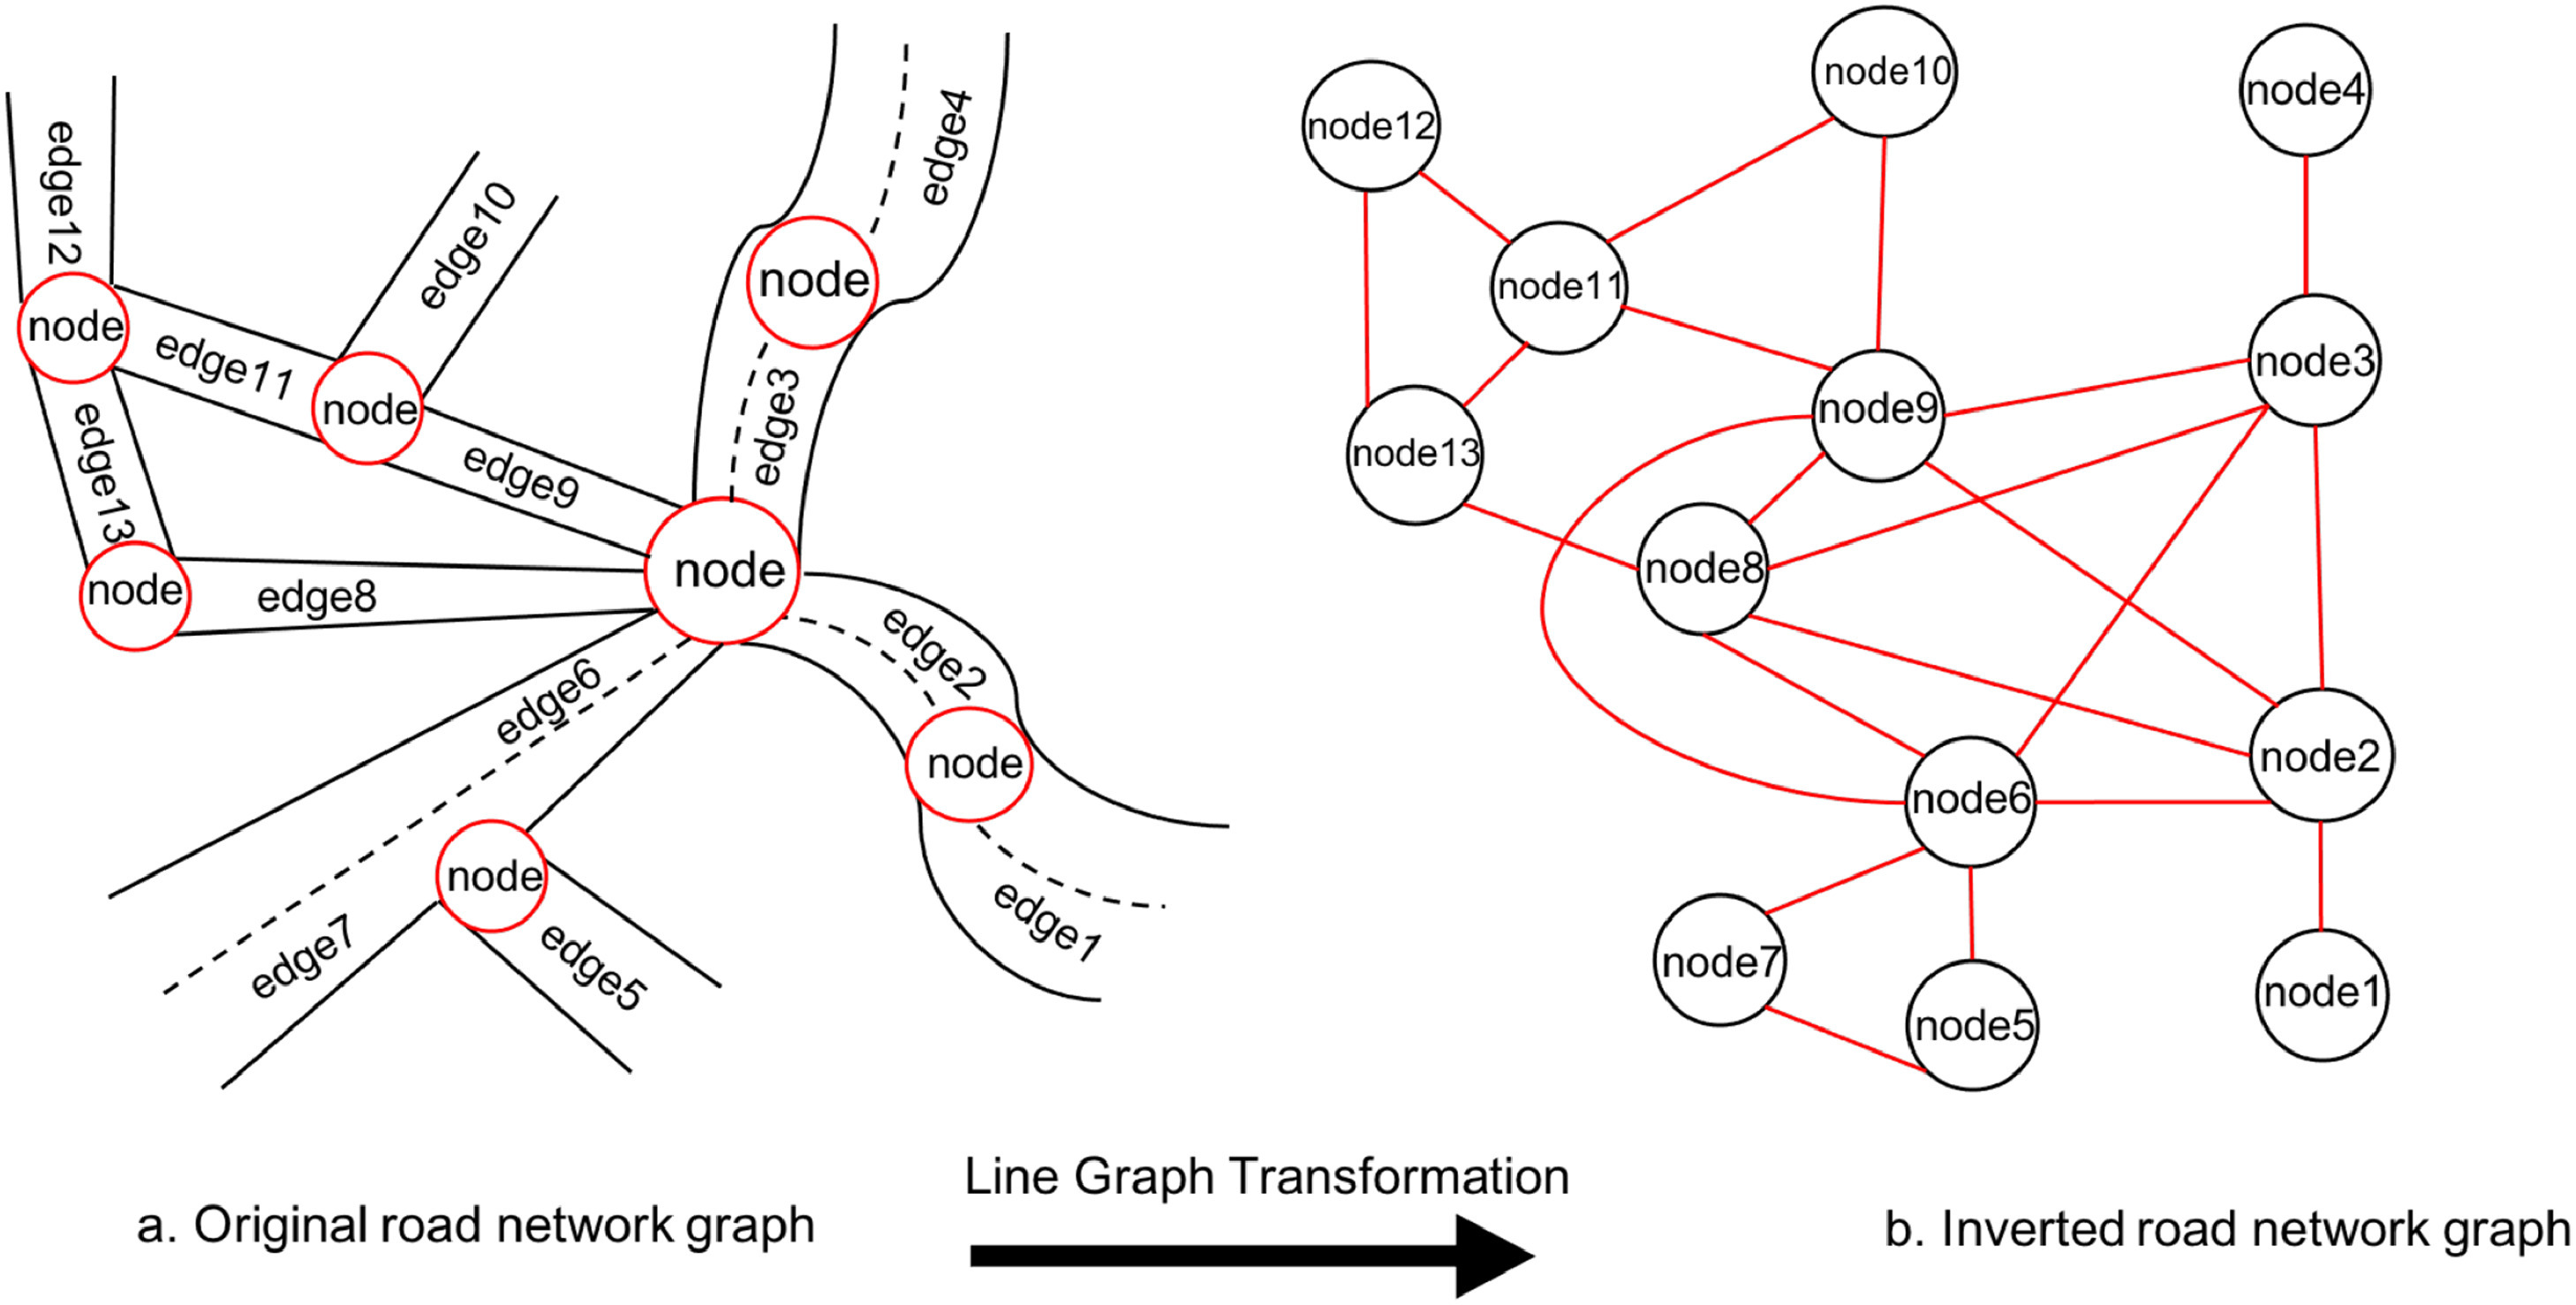
Why Line Graph?
- Road network graphs consider road segments as graph edges and crossroads, junctions, and intersections as graph vertices. However, this approach suffers from a limited feature representation of vertices since there are not sufficient features describing crossroads and intersections that are essential for road network representation.
- Conventional graph representation learning models apply the features describe merely the vertices and not the edges for learning.
Neighborhood Sampling
We apply both local and global neighborhoods to provide nodes with two perspectives: the local view captures information from nearby neighbors within a fixed radius, while the global view extracts insights from distant, related nodes. This dual representation enhances the learning process and improves node representations.
To generate the second view as mentioned above, we developed a global unbiased random walk with fixed radius double the size of local random walk. All topological neighbors visible to a node through both views are then mixed and shuffled to be used for training the system.
GAIN: Graph Attention Isomorphism Network
GAIN introduces a novel aggregation approach by applying attention and a summation operation to combine the representation vectors of neighboring nodes \(\forall u \in N(v) \) at each learning iteration \(k\). These vectors are weighted by attention scores \(a_{v,u}\) and then integrated into the sampled node's representation \(h_v\), scaled by epsilon \(\epsilon\), which can be either a fixed or learnable parameter. This method ensures that the node prioritizes its neighbors based on their significance, as indicated by the attention weights, while using the summation over attention heads for aggregation:
$$ h_v^k = \text{MLP}^k \left( (1 + \epsilon^k) \cdot h_v^{\prime (k-1)} + \sigma \sum_{u \in N(v)} a_{v,u}^{k-1} \cdot h_u^{\prime (k-1)} \right) $$
where MLP is the multi-layer perceptron, and \(h_u^{\prime} = W^{\prime} \cdot h_u\) shows the linear transformation of node \(u\) into a higher representation space applying weight matrix \(W^{\prime}\). \(\sigma\) can be a non-linearity (ELU) or the Identity function. \(N(v)\) is the neighborhood of node \(v\).
Loss Function
Supervised Learning
For supervised learning, ground-truth road type labels of graph vertices are used for calculating a cross-entropy loss function for our multi-class road type classification problem. The representation vectors received from the aggregation function are normalized by \(l_2\) normalization and input to a one-layer fully connected neural network to predict class labels, which are then used to calculate the supervised loss value
Unsupervised Learning
A fully unsupervised setting uses a graph-based loss function to the positive case representation vectors sampled from a set of topological neighbors and negative case sampling distribution, \(P_n\):
$$ J_G(z_v) = -\text{log} (\sigma (z_v^T z_u)) - \displaystyle E_{u_n \sim P_n(u)} \text{log}(\sigma(-z_v^T z_{u_n})) $$
where \(z_v\) and \(z_u\) are the output representation vectors of sampled node \(v\) and topological neighbor node \(u \in N(v)\). The loss function uses a sigmoid \(\sigma\) and negative case sampling distribution \(P_n\). Thus, \(z_{u_n}\) is a negatively sampled neighbor of node \(v\).Experiments
Feature Attributes of the input graph nodes:
- The length of road segments with 1 dimension.
- The midpoint coordinates of adjacent start and end nodes in longitude and latitude with 2 dimensions.
- The geometry sampled to a fixed-length vector of 20 equally distanced points. along the length of road segments, which is subtracted by the midpoint coordinate (i.e. 20 longitudinal and latitudinal distances from the midpoint) and is composed of 40 dimensions.
- The one-hot-encoding of the speed limits with 13 and 15 standard values for transductive and inductive tasks, respectively.
Ground-truth labels:
- Class (1): Highway, yes, primary, secondary, motorway-link, trunk-link, primary-link, secondary-link.
- Class (2): Tertiary, tertiary-link.
- Class (3): Road, planned, unclassified (minor roads of lower classification than tertiary).
- Class (4): Residential.
- Class (5): Living-street
Learning Paradigm:
- Supervised
- Unsupervised
Tasks:
- Transductive: Train, validation, and test nodes sampled from a single city graph. The model can leverage information from the entire graph during learning.
- Inductive: different city graphs used for train (13 cities), validation (2 cities), and test (2 cities) sets. This requires the model to transfer knowledge to unseen graph structures.
Exhaustive Grid Search
Results
The Micro-Averaged F1-Score is employed to select the top-performing model from those trained through our exhaustive grid search. This selected model is then used to evaluate the performance of GAIN during inference.